The stock market has been “off to the races” to start 2018, as the S&P 500 is testing the 2800 price level.
Stock prices continue to stretch higher. Let’s discuss what’s happening and what stock market cycles are telling us here.
S&P 500 Summary and Market Cycle Outlook:
The S&P 500 moved higher last week, rising by 1.6%.
China’s central bank noted indicated that it would reduce its US bond allocation, and then walked the statement back, after bond prices decreased.
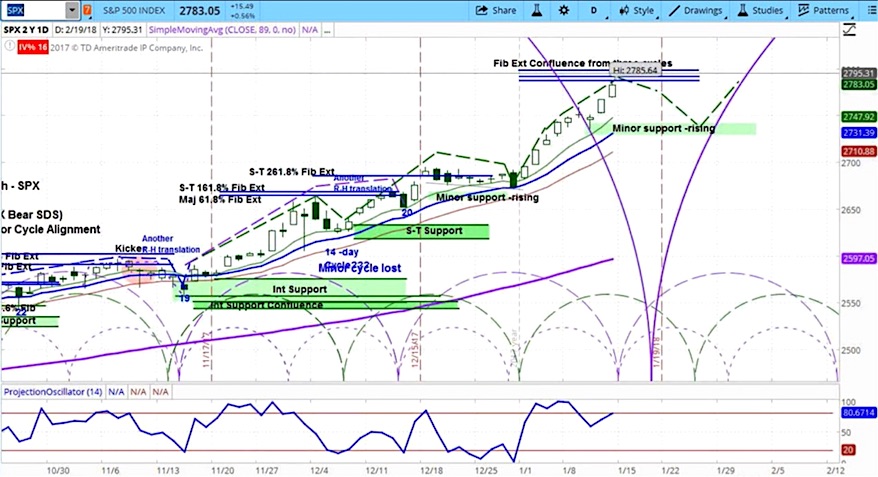
Our projection is for stocks to decline to between the 2742 and 2728 levels, as the current market cycle points to a pullback.
The stock market moved higher last week, with the S&P 500 (SPX) up 43 points to 2786, another all-time high.
On Monday, technology stocks, including semiconductors, led the move higher. On Tuesday, the Japanese Yen rose and US bond prices fell, as the Bank of Japan announced a reduction in their program to purchase government bonds. With interest rates higher, US financial stocks led the way higher, as banks tend to benefit when rates increase.
On Wednesday, the People’s Bank of China indicated it was considering a reduction in its portfolio of US government bonds. The bond market and the dollar index fell on the news. Equities fell premarket but bounced back, again led by financial stocks as well as retail.
On Thursday, the Bureau of Labor Statistics released the Producer Price Index results for December: a decline of 0.1% as compared to a rise of 0.4% in November. This was the first time the index has fallen in over a year. The Consumer Price Index, released on Friday, showed a 0.3% increase. Bond prices edged lower. Check out this video for our view on bonds.
The daily chart above shows our projection for the S&P 500 (SPX) in the coming week: a correction to the support zone of between 2742 and 2728. Once this cycle completes, the SPX may move higher again. The green-dotted half circles represent the short-term market cycles for Russell 2000 (RUT). The RUT market cycles appear to be driving SPX price more so than the SPX cycles.
For a more detailed look at cycle analysis for a broader selection of futures, watch the askSlim Market Week every Friday afternoon.
The latest askSlim Market Week Video:
Twitter: @askslim
Any opinions expressed herein are solely those of the author, and do not in any way represent the views or opinions of any other person or entity.
: Showing Some Signs of Emerging Strength")


: Showing Some Signs of Emerging Strength")