Stock Market Outlook for January 17, 2018
Technical divergence wins the intraday motion but buying on pullbacks still viable – buying on pullbacks still provides the least risk.
Bullish undercurrents provide support but failure to recapture yesterday’s support will be troubling in the short term
Note that you can access today’s economic calendar with a full rundown of releases.
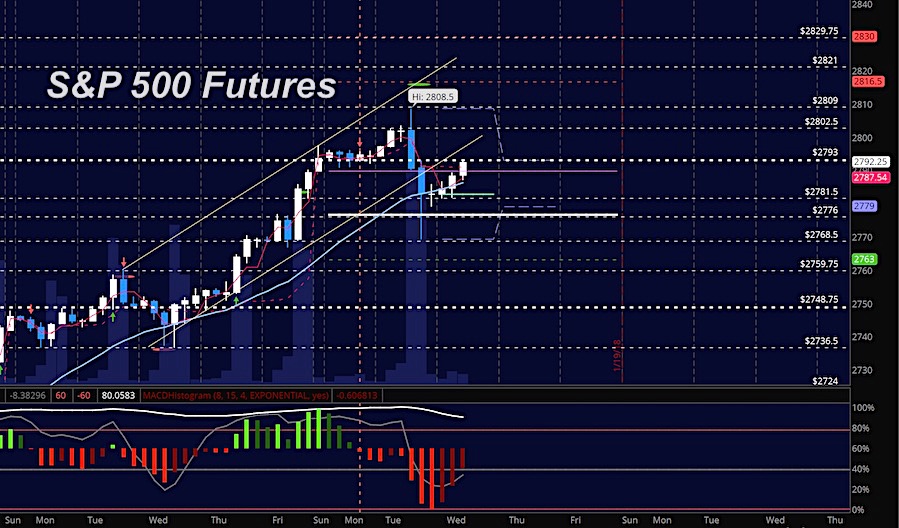
S&P 500 Futures
Support to recapture is now above 2794 for buyers to continue to hold control. Only Intraday short positions are viable in these formations- but below 2768 we will have bears try to force us further so again, watch your support. The bullets below represent the likely shift of trading momentum at the positive or failed retests at the levels noted.
- Buying pressure intraday will likely strengthen with a positive retest of 2794
- Selling pressure intraday will likely strengthen with a failed retest of 2789
- Resistance sits near 2792.75 to 2802.5, with 2808.5 and 2812.75 above that.
- Support holds between 2789 and 2781.5, with 2768.5 and 2759.5 below that.
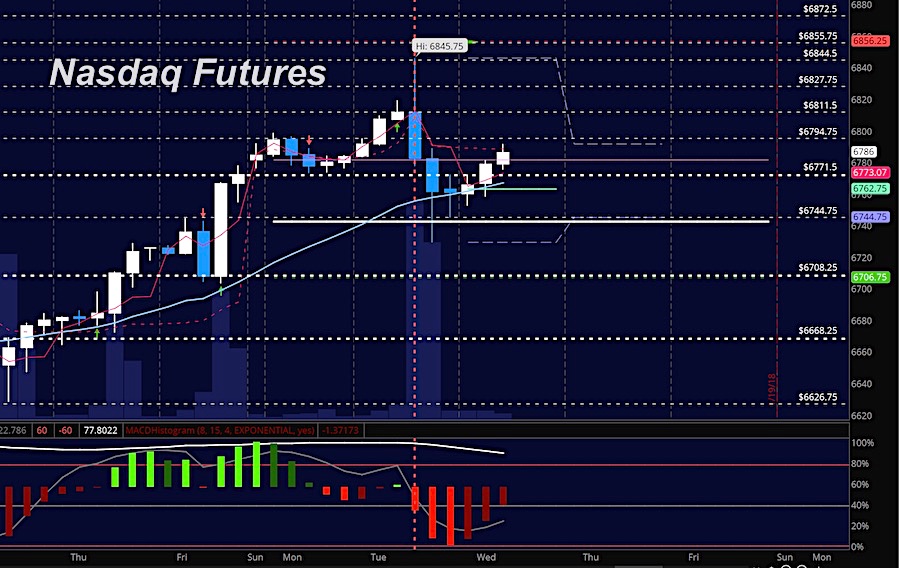
NASDAQ Futures
After a dip lower than originally anticipated, the traders lifted the chart right back into resistance this morning – which is yeaterday’s support region near 6794.75. Momentum is still bullish but support watches are important for those of us trading the bounce patterns. Failure to breach old support will mean a breakdown of buying strength. The bullets below represent the likely shift of intraday trading momentum at the positive or failed tests at the levels noted.
- Buying pressure intraday will likely strengthen with a positive retest of 6796.75
- Selling pressure intraday will likely strengthen with a failed retest of 6760
- Resistance sits near 6794.5 to 6811.5 with 6827.5 and 6845.75 above that.
- Support holds near 6762.5 and 6744.75, with 6727.5 and 6706 below that.
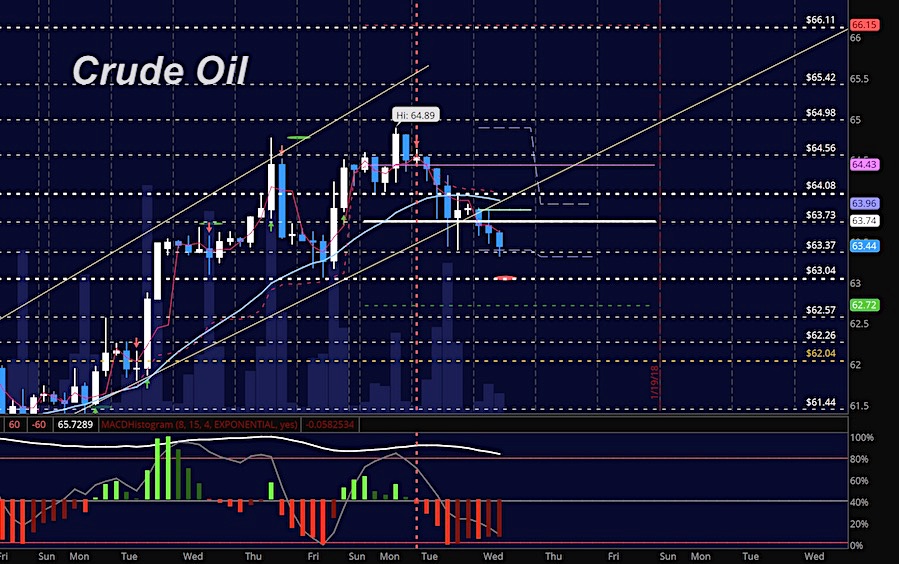
WTI Crude Oil
Traders are chopping around familiar regions near 63.35 before the API release after the close today. Selling pressure may increase as traders move from one contract month to the next, so selloff may not correlate in the forward contract due to roll in just a few days. The bullets below represent the likely shift of trading momentum at the positive or failed tests at the levels noted.
- Buying pressure intraday will likely strengthen with a positive retest of 64.13
- Selling pressure intraday will strengthen with a failed retest of 63.3
- Resistance sits near 63.92 to 64.08, with 64.43 and 64.89 above that
- Support holds near 63.31 to 63.04, with 62.72 and 62.26 below that
If you’re interested in the live trading room, it is now primarily stock market futures content, though we do track heavily traded stocks and their likely daily trajectories as well – we begin at 9am with a morning report and likely chart movements along with trade setups for the day.
As long as the trader keeps himself aware of support and resistance levels, risk can be very adequately managed to play in either direction as bottom picking remains a behavior pattern that is developing with value buyers and speculative traders.
Twitter: @AnneMarieTrades
The author trades stock market futures every day and may have a position in mentioned securities at the time of publication. Any opinions expressed herein are solely those of the author, and do not in any way represent the views or opinions of any other person or entity.


