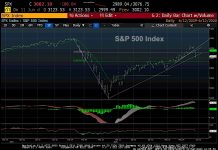
Every Bull Market Endures Several Counter-Trend Moves
RED SCREENS VS. REALITY
We all know even in the context of a bullish trend, the stock market does not go up every day, and...
Commodity Index Rallies Back To Key Inflection Point
TR Equal Weight Commodity Index "monthly" Chart
After peaking in 2011, Commodities have traded in a tight declining trend channel.
The falling trend channel is marked...
Nasdaq 100 Reverses Higher, Price Target Sits at 11280
Nasdaq 100 Chart - Trading Analysis
The latest decline in the Nasdaq 100 Index may have reached a short-term bottom
This idea has been given life...
Stock Market Update: Too Far, Too Fast
The stock market was down sharply on Thursday after Federal Reserve Chairman Powell’s press conference stating concerns over high unemployment and projecting the road...
Top Technical Trend Trading Ideas: Square Stock (SQ)
$SQ Square Stock Chart Technical Analysis
One of our top technical ideas here is Square (SQ) currently trading at $87.70.
Square is trading above the rising...
3 Option Trade Ideas On Microsoft Stock $MSFT
Microsoft (MSFT), like most of the tech sector, has been a strong performer recently with the stock rising from 132.15 to a recent high...
Did the Stock Market Really Top?
After last Thursday’s nearly 1900-point decline, I recorded a video for StockChartsTV.
Then, on Friday, we saw four distinct trading patterns emerge.
First, many instruments had...
2020 Providing Plenty of Volatility but Little Progress
Key Stock Market Takeaways:
- Knowing the ride keeps investors leaning in the right direction
- Consolidation could provide breadth leadership and renewed skepticism
- Copper suggest...
S&P 500 Index Trading Outlook: Will Sharp Decline Find Buyers?
S&P 500 Index INDEXSP: .INX Trading Chart
S&P 500 Trading Outlook (3-5 Days): Looks right to buy into Thursday's weak close for early strength on Friday, but Support...
Chart of the Week: Financial Sector ETF (XLF) Faces Key Resistance
With all eyes on the Fed this week, along with all of the other macro influences, I’m digging into the charts and noticing the...


