Nasdaq 100 Chart – Trading Analysis
The latest decline in the Nasdaq 100 Index may have reached a short-term bottom
This idea has been given life by the recent reversal higher.
And it’s even more noteworthy when its a market leader.
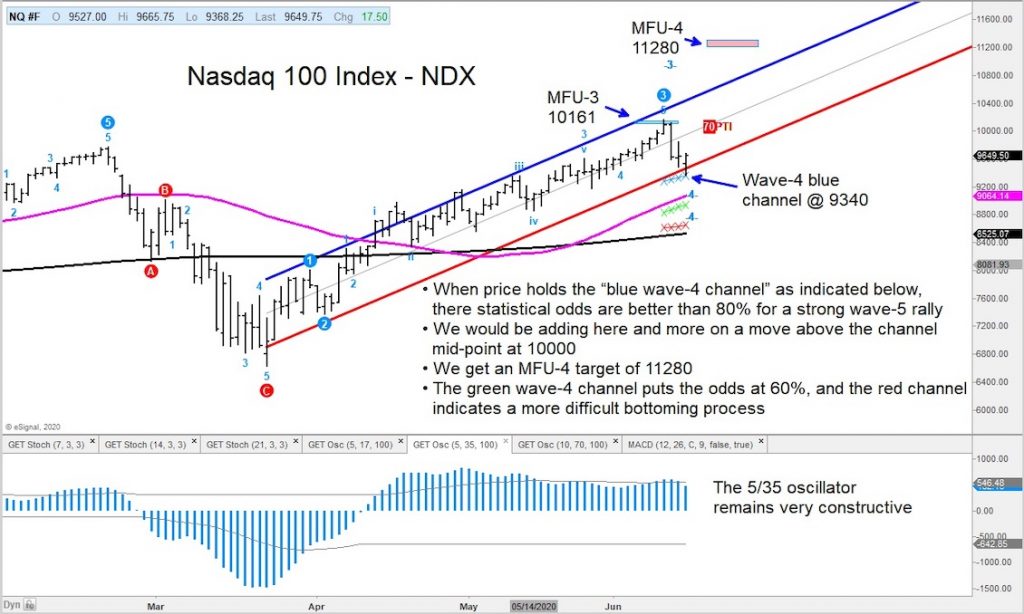
Here’s a more detailed insight: When price holds the “blue wave-4 channel” as indicated in the chart, there are improved statistical odds for a strong wave 5 rally.
Should the rally see follow-through buying, it could see our MFU-4 price target at 11280.
I would also note that the S&P 500 went slightly below its wave-4 blue channel and is now above it, which is positive.
The author may have position in mentioned securities at the time of publication. Any opinions expressed herein are solely those of the author, and do not in any way represent the views or opinions of any other person or entity.


