Interest rates have been pulling back over the past few weeks and this has given treasury bond prices a lift.
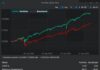
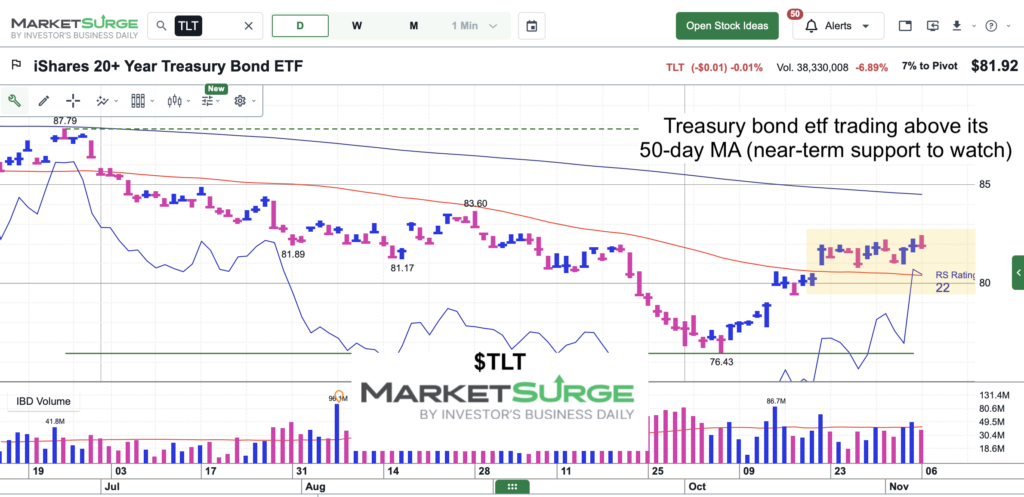
The rally (as seen in the chart below of the highly followed ETF $TLT), has given bulls a reason to think this rally might last for more than a hot second.
For consumers, it would be nice to see the decline in interest rates hold for a while. That said, we don’t want to see a sharp decline as that may imply a recession.
Either way, from a charting perspective $TLT bulls would like to see it hold above its 50-day moving average. See chart below.
Note that the following MarketSurge charts are built with Investors Business Daily’s product suite.
I am an Investors Business Daily (IBD) partner and promote the use of their products. The entire platform offers a good mix of tools, education, and technical and fundamental data.
$TLT 20+ Year U.S. Treasury Bonds ETF Chart
Twitter: @andrewnyquist
The author may have a position in mentioned securities at the time of publication. Any opinions expressed herein are solely those of the author, and do not in any way represent the views or opinions of any other person or entity.