I Built a Buy-the-Dip Stock Strategy With One Sentence. Here Is How It Did Since 2005.
Most traders have an idea like this one: good stocks that sell off hard for a day or two tend to bounce. Buy the dip, sell the bounce.
The idea is easy to say and hard to check. Testing it properly means 500+ stocks with accurate index membership dates, twenty years of prices, position limits and a rule for which dips to buy when there are more signals than you have money for. That used to mean code, or days (weeks) in a spreadsheet.
I tested it by typing one paragraph into an AI assistant connected to Build Alpha.
The idea in plain English
- What to buy: stocks in the S&P 500 that have dropped sharply over the last two days. I measure that with the 2-period RSI, a short-term momentum gauge that runs from 0 to 100. A reading below 10 means a stock has been hit hard.
- When to sell: as soon as the stock closes above the previous day’s high. That is the bounce.
- How much to buy: 10% of the account in each stock, with no more than 10 stocks at once.
- Which dips to pick: on days with more than 10 candidates, I take the calmest stocks first, meaning the ones whose daily price swings are smallest relative to their price. A steady stock having a bad two days is a better bet than a wild stock having another wild week.
The exact prompt
Build Alpha, the strategy testing software I build, now connects to AI assistants such as Claude. That means I can describe a strategy in plain English and the software sets it up and runs it. This is the prompt:
“Build a mean reversion buy-the-dip strategy. Buy when the 2-period RSI is below 10 and sell at the first sign of strength when price closes above the previous day’s high. Run this on the S&P 500 index stocks and put 10% into each position with a maximum of 10 open positions. When there are more signals than open slots, rank stocks by their 20-day ATR as a percentage of price and buy the least volatile names first. Test from 2005 to the present day and show me the equity curve. Save the strategy to my Portfolio so I can monitor every day.”
No code and no menus. The assistant translated each sentence into Build Alpha’s settings: the entry rule, the exit rule, the stock universe, the position size, the limit of 10 positions and the ranking. Then it ran the test across the full history and returned the results.
Review the settings before you run it
One habit I picked up early: before the test runs, I ask the assistant to open the Strategy Builder so I can review the settings visually. A prompt never covers everything. I did not say what commission to charge, how much slippage to assume or exactly which list of stocks to use, so the software filled in reasonable defaults.
Opening the Strategy Builder shows me every one of those choices on a single screen. I can double-check that the rules match what I meant and that the costs and the stock universe are sensible. If something is off, I send one more line of text or just change the setting myself with a click. Then I tell it to run or click the Simulate button.
It takes a minute, and it is the difference between testing the idea you had and testing the idea the computer guessed you had.
The results
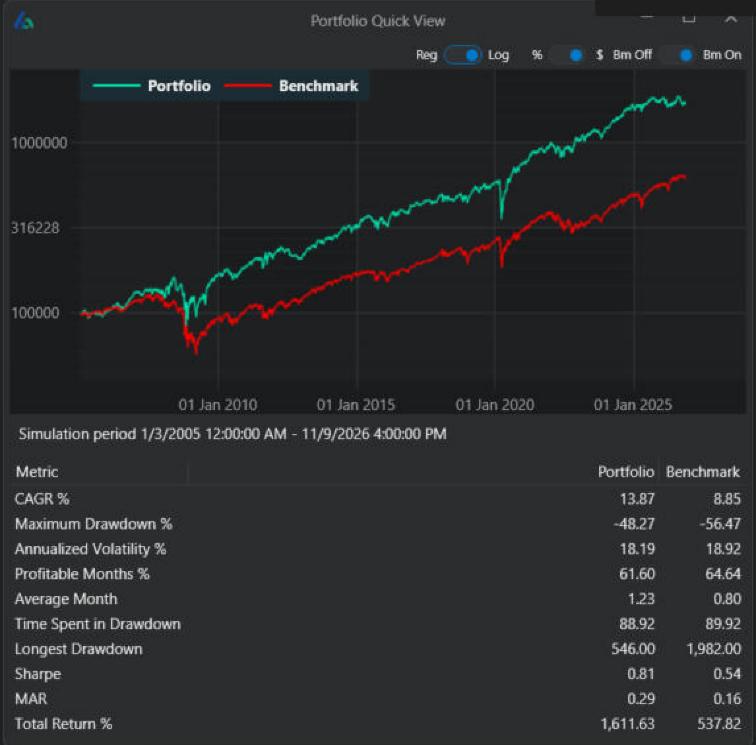
From January 3, 2005 through November 9, 2026, a $100,000 account following these rules grew to about $1.71 million.
| Measure | Strategy | S&P 500 benchmark |
| Total return | 1,611.6% | 537.8% |
| Average annual return | 13.87% | 8.85% |
| Largest drawdown | -48.27% | -56.47% |
| Longest drawdown | 546 days | 1,982 days |
| Winning trades | 66.9% | |
| Number of trades | 11,949 | |
| Average holding time | 4.4 trading days |
Two things stand out on the chart. The strategy earned about 5 percentage points a year more than the benchmark, and it won roughly two trades out of three while holding each stock for less than a week.
This simple strategy was not a smooth ride. The strategy lost 48% from peak to trough in the 2008 to 2009 bear market, because it keeps buying dips while the whole market is falling and has no stop loss. That was still less than the benchmark’s 56% fall, and it recovered far sooner: its longest stretch below a prior high was 546 days, against 1,982 for the benchmark. You can see the same pattern on a smaller scale in early 2020.
The test is stricter than most. It only trades a stock while it was actually in the S&P 500, so companies that were later removed or went under are included. Orders fill at the next morning’s open, and every trade pays commission and slippage.
What I take from it
- Simple (and complex) rules can be tested, so test them. “Buy the dip” is a slogan until you put numbers on it. This test took one paragraph.
- The selection rule matters as much as the signal. Plenty of stocks get oversold on the same day. Choosing the calmest ones is a decision, and it changes the outcome.
- Check the settings before you trust the result. A one-minute review of what the software assumed is worth more than any single number in the table.
- Position limits keep it realistic. Ten positions at 10% each is a portfolio a real person can run.
The point is not that this particular strategy is the answer. The point is that the distance between a trading idea and an honest look at its history is now one prompt. Collaborate with AI not fully trust it.
This is a historical test, not a recommendation. Past results do not guarantee future returns.
David Bergstrom is the founder of Build Alpha, software for building and testing trading strategies without code. He is a market maker and quantitative strategy developer at a high-frequency trading firm with a CME seat.
Twitter: @DBurgh @buildalpha
No position in any of the mentioned securities at the time of publication. Any opinions expressed herein are solely those of the author, and do not in any way represent the views or opinions of any other person or entity.