US bond yields are rising again and higher mortgage and auto rates could make consumers a bit uneasy.
And perhaps A LOT uneasy if bond yields break out to the upside.
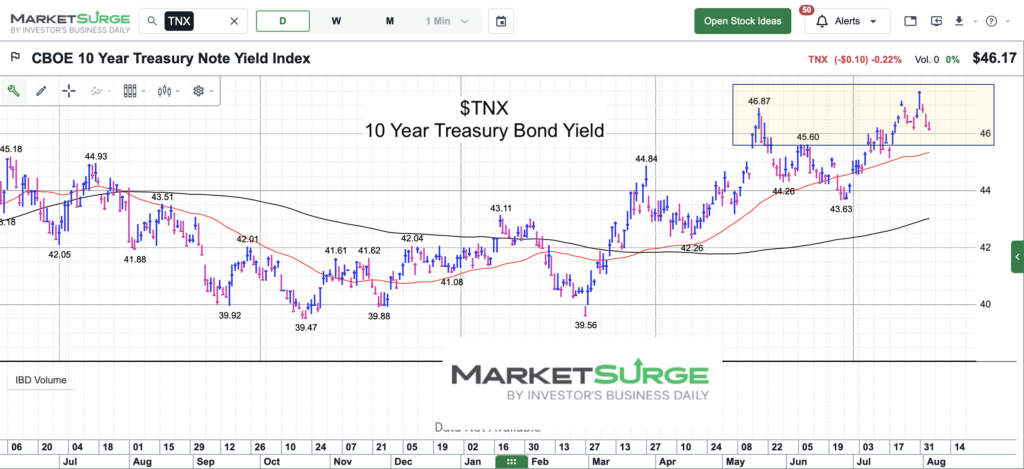
Today, I share a simple chart highlighting exactly where interest rates are and why this is an important juncture.
Financing is the lifeblood to much of the opportunity that presents itself in our economy. Let’s hope bond yields (interest rates) stall out and fall back into the 3.6 to 4.6 percent range.
Note that the following MarketSurge charts are built with Investors Business Daily’s product suite.
I am an Investors Business Daily (IBD) partner and promote the use of their products. The entire platform offers a good mix of tools, education, and technical and fundamental data.
$TNX 10 Year US Treasury Bond Yield Chart
Twitter: @andrewnyquist
The author may have a position in mentioned securities at the time of publication. Any opinions expressed herein are solely those of the author, and do not in any way represent the views or opinions of any other person or entity.