RED SCREENS VS. REALITY
We all know even in the context of a bullish trend, the stock market does not go up every day, and yet, for some reason it is difficult for all of us to remember that during inevitable drawdowns.
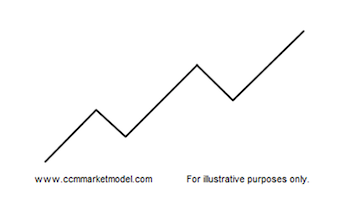
All uptrends feature a primary trend and normal countertrend moves. This is easy to understand from a textbook perspective, but harder to grasp when markets begin to backtrack.
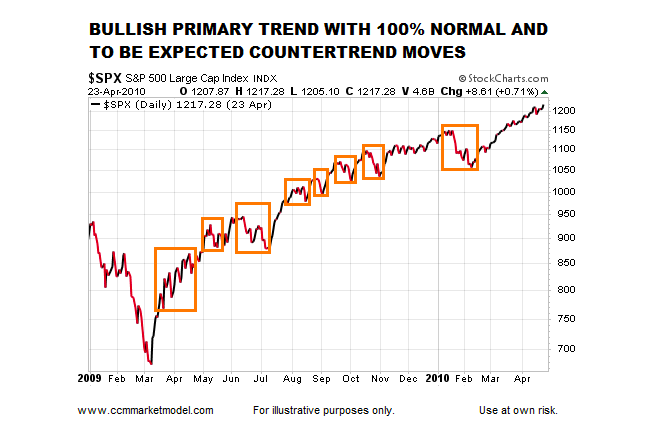
The chart below shows a massive percentage move for the S&P 500 Index that began after the major low in March 2009 and lasted over a year. If an investor wanted to participate in the very satisfying longer-term gains, they had to endure a ton of gut-wrenching volatility along the way. This is the rule rather than the exception in the world of investing.
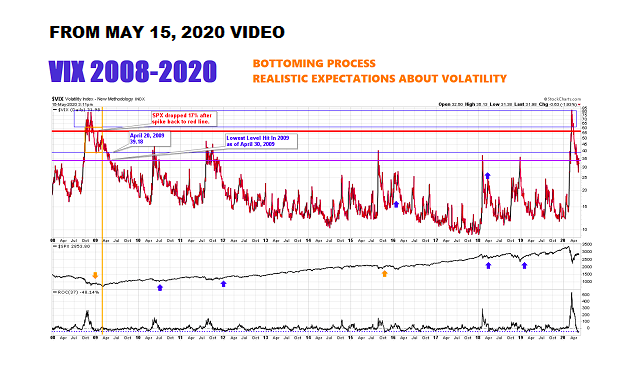
The image below was covered in the May 15, 2020 video. The S&P 500 Index closed at 2863 on May 15. There is a reason the videos have featured “REALISTIC EXPECTATIONS” in large orange text over and over again in recent weeks; we know it is only a matter of time before a strong bullish trend enters a “give back” period.
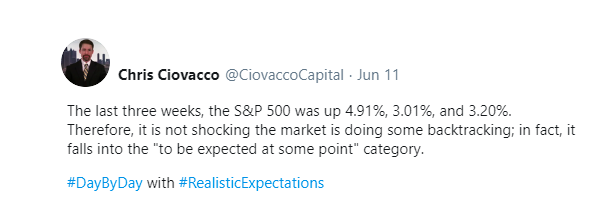
We experienced unnerving volatility last week, which is not shocking given the prior three weeks featured very satisfying gains.
BIG SPIKE IN VOLATILITY EXPECTATIONS
As noted in the June 12 weekly video, the trading session on Thursday, June 11 was extremely slanted in the risk-off direction. A number of ugly data points were produced that day, including a big spike in the Volatility Index (VIX). Since the VIX measures market participants’ volatility expectations looking out 30-days, it might be helpful to know how the market performed following similar spikes.
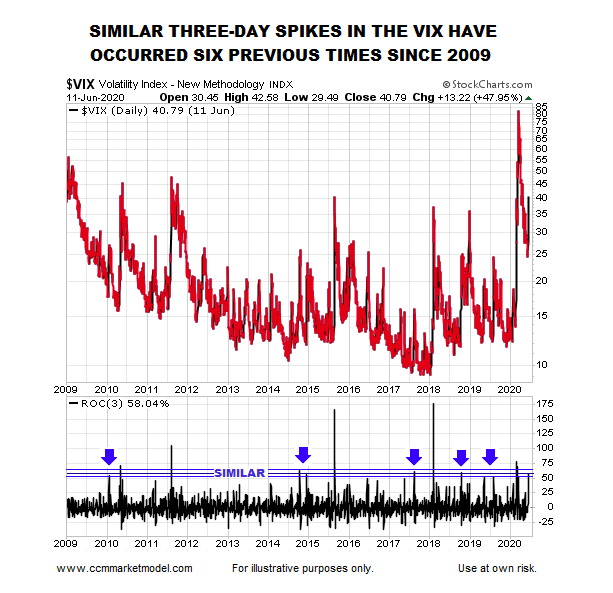
The VIX three-day rate of change (bottom of chart above) was 58.04% as of the close on Thursday, June 11, 2020. We studied cases with a similar three-day rate of change (those inside the blue bands). S&P 500 performance over the next week to three years is shown in the table below.
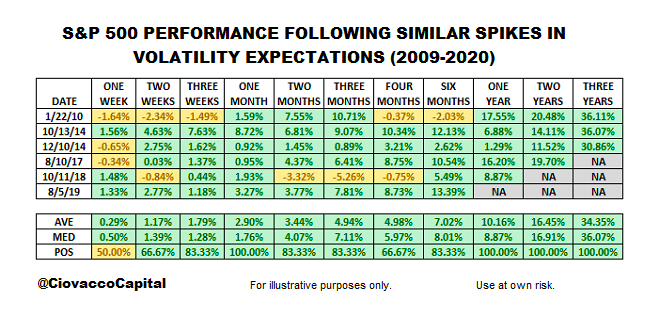
The message from the table above is basically identical to the data-based message covered in recent weekly videos:
- A wide range of factual evidence covered since April 6 tells us to be open to better than expected long-term outcomes (six months to five years).
- A wide range of factual evidence also says the next six months could feature increased volatility, pullbacks, and/or stock market corrections
- Historically, if an investor wanted to capture the satisfying one-year, two-year, and three-year returns shown in the table above, they had to endure 100% normal and to be expected volatility (account balances went up and down; not just up).
“OPTIMISM CAN ONLY GET THE ECONOMY SO FAR”
The text above was the title of a Wall Street Journal print-edition article dated June 13, 2020. Having worked on Wall Street for over 20 years, we have seen this basic headline after every major bear market and correction since the mid-1990s. The article points out that University of Michigan consumer sentiment today “is near its lowest levels since 2012” and Republican-respondent data in the survey has not been this bad since October 2016; Democrat-respondent data has not been this pessimistic since “the fall of 2008”. Thus, it might be helpful to know was it profitable to invest in those three periods that have similar sentiment characteristics to June 2020? The answer in all three cases was yes (see graphs below).
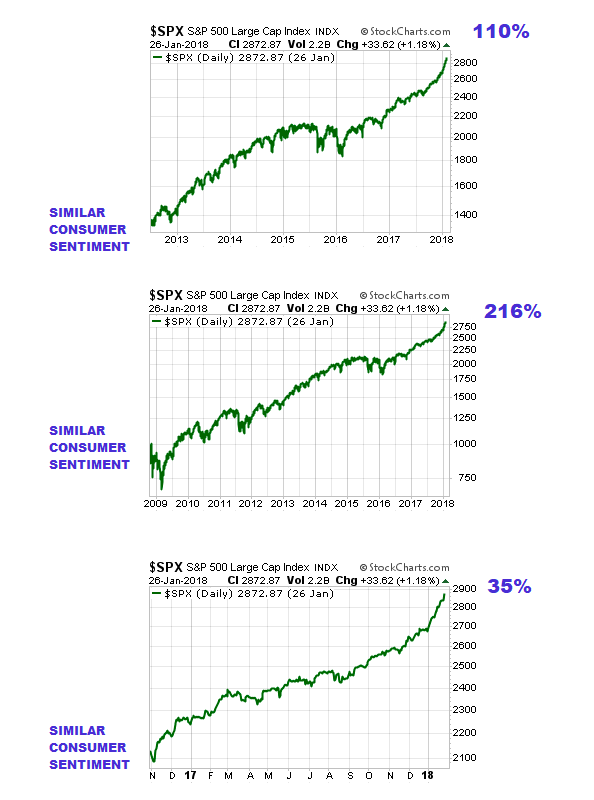
We are all familiar with the concept that “markets climb a wall of worry”. Therefore, it is not particularly alarming consumers feel somewhat pessimistic today (it aligns with other data we have covered in recent weeks).
DATA SPEAKS TO PROBABILITIES
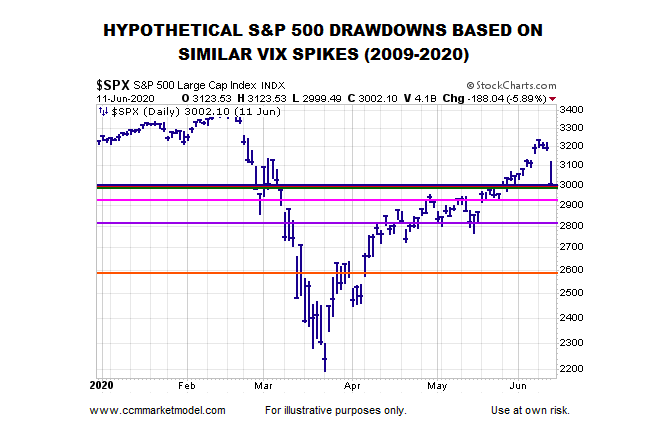
History and 2020 data tell us last week’s volatility was not particularly surprising or shocking, and it would not be surprising to see more volatility over the next six months. The table below shows the maximum S&P 500 drawdown in the historical cases (2009-2020) that featured a similar spike in volatility expectations.
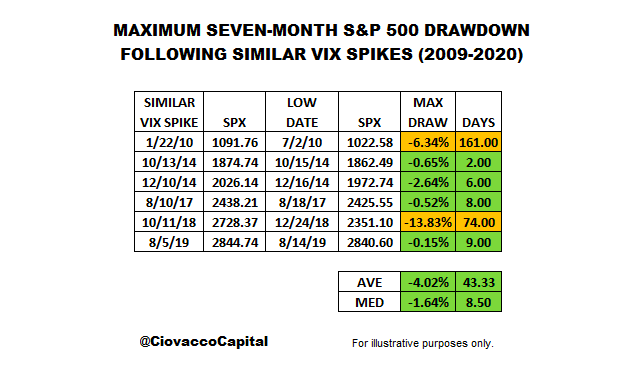
The first takeaway from the table above is historically similar three-day pops in the VIX were not necessarily followed by significant additional S&P 500 drawdowns over the next seven months. The second takeaway is further volatility would not be out of the historical norm. Given the three-day spike was calculated as of the close on Thursday, June 11, 2020, the chart below shows what the historical drawdowns would hypothetically look like on a 2020 S&P 500 chart.
BEARISH CONCERNS
Are there some legitimate concerns about the present market? Yes, there are always things to be concerned about in the stock market. However, a few areas are noteworthy:
- Thursday’s gap down session and spike in the VIX does not align well with many of the bullish cases we have covered in recent weeks, allowing us to remain open to worse than expected outcomes.
- Unfilled gaps remain below Friday’s S&P 500 closing price. Thus, even under a longer-term bullish scenario, a larger than expected drawdown could occur in the coming weeks.
- The virus remains a major wildcard.
- Beijing has had a relatively low number of cases over the past six months. Thus, even a relatively small increase in cases raises concerns of a possible new hot spot for the virus; it is just something that needs to be watched and respected.
The important thing from a risk-management perspective is to evaluate new data with an open mind about a wide range of outcomes from wildly bullish to wildly bearish. We will see how things play out during Monday’s full session and over the coming weeks.
Twitter: @CiovaccoCapital
The author or his clients may hold positions in mentioned securities at the time of publication. Any opinions expressed herein are solely those of the author, and do not in any way represent the views or opinions of any other person or entity.


