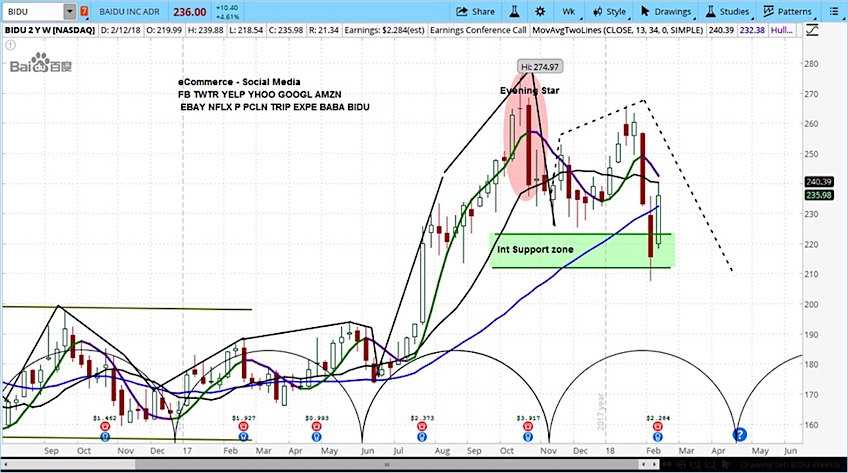
Baidu (BIDU) Pops On Earnings But Faces Cyclical Headwinds
Baidu (BIDU) reported earnings of $2.29 per share and revenue of $3.6 billion, which beat expectations of $2.05 per share and $3.4 billion. The...
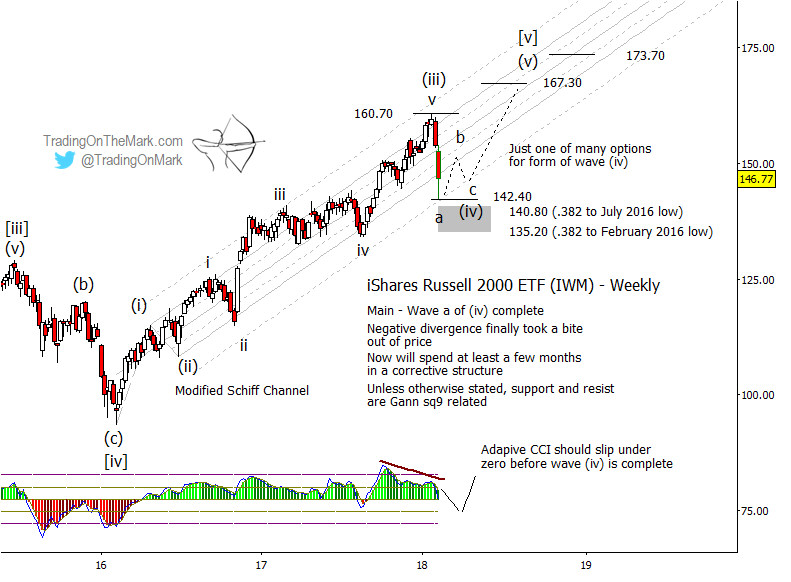
Russell 2000 Elliott Wave Forecast: Higher Target Possible
The recent correction in U.S. stock indices is on par with expectations we described last October. Now we highlight some supports and targets to...
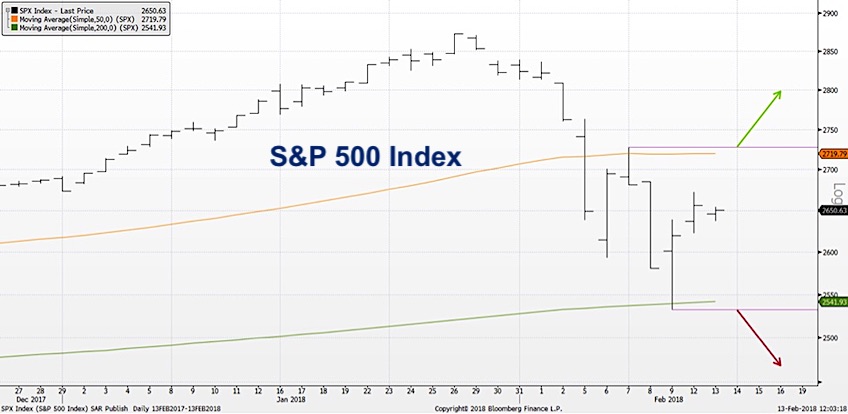
The Beauty Of A Range-Bound Stock Market
After a 12% correction over the last two weeks, traders are left to question what the next two weeks and beyond may have in...
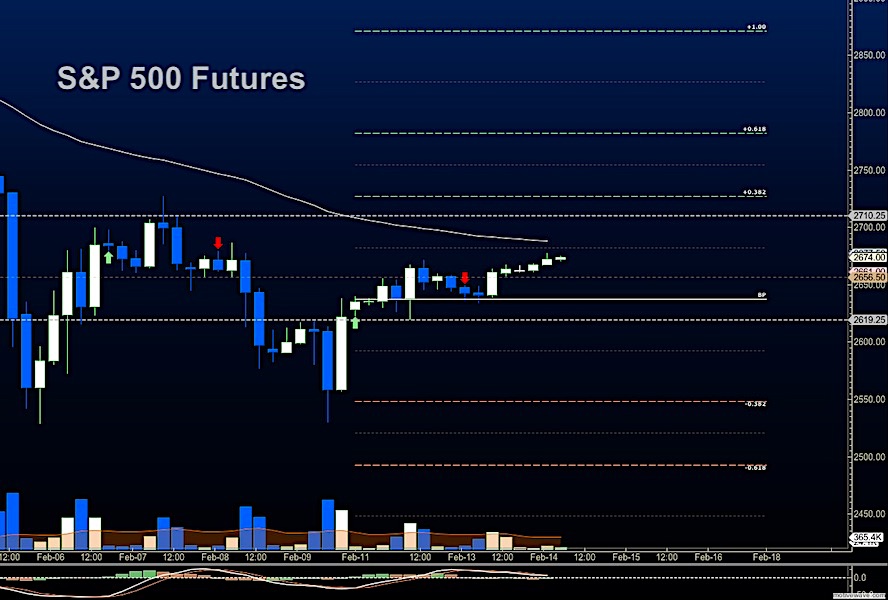
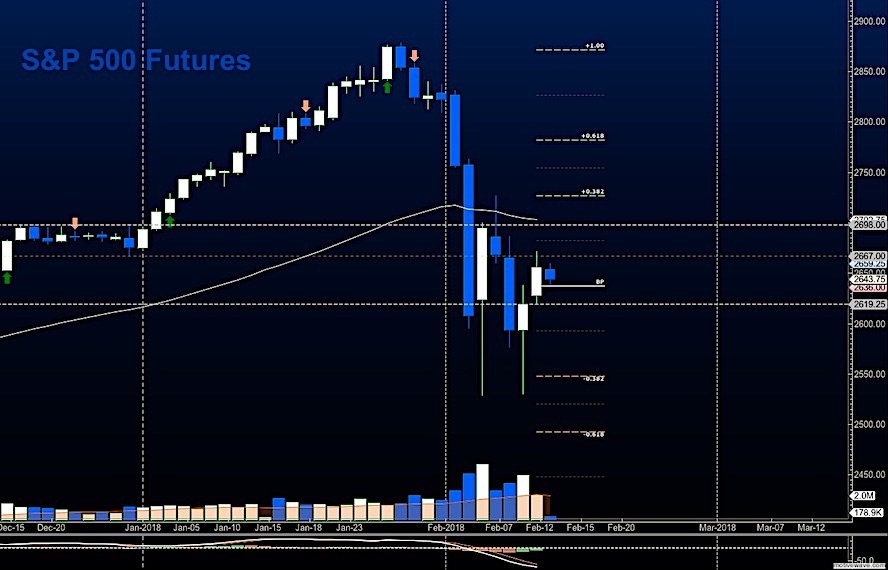
S&P 500 Futures Trading Outlook For February 14
Broad Stock Market Outlook for February 14, 2018
Stocks are running into price resistance this morning as crosscurrents prevail. Pullbacks should find buyers, but traders will...
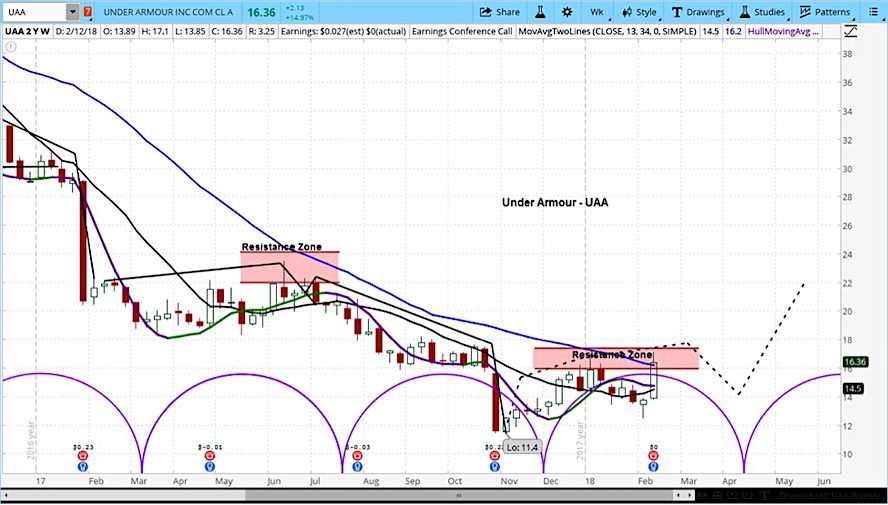
Under Armour Stock Surges On Earnings… But It’s Not A Buy Yet
Under Armour (UAA) surged 15% after it reported earnings per share that met Wall Street estimates and exceeded on revenue, posting $1.4 billion versus...
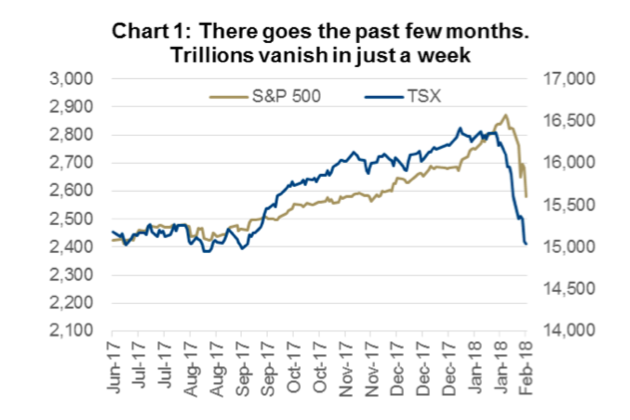
Stock Market Rattled But Fundamental Growth Story Still Intact
Last week we wrote a piece titled “Rising Bond Yields Rattle Equity Markets.” Well, bond yields tolled alright, and equity markets found their bell...
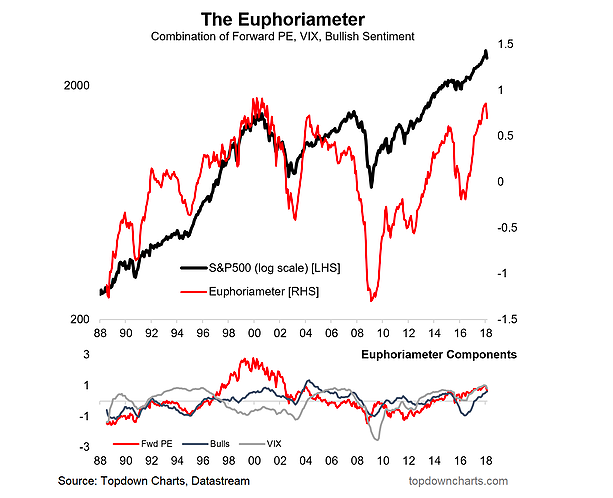
Investor Sentiment Update and Outlook: 5 Charts
The much awaited and widely predicted correction (that no one really ended up predicting) has turned 2 weeks old now, and driven the S&P...
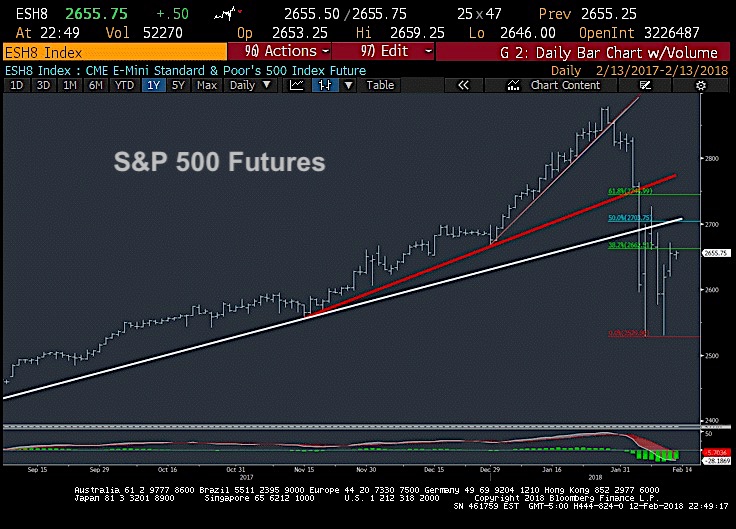
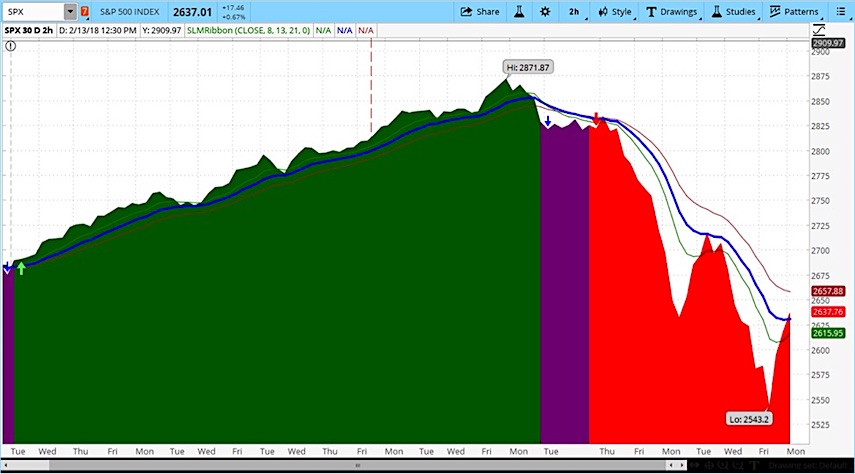
S&P 500 Trading Update: Rally Eyes Short-Term Resistance
S&P 500 Trading Outlook (2-3 Days): MILDLY BULLISH
The S&P 500 has covered a lot of ground in the last nine trading hours, recouping nearly 40% of...
Stock Market Futures Update: Bounce Helps Trapped Buyers
Broad Market Outlook for February 13, 2018
Cross currents are bringing choppy action as price resistance formations form. Traders need to be careful with buying extended...
Stocks Bounce Higher But Market Risks Loom
Monday saw stocks continue the bounce that started on Friday. That day the S&P 500 rallied back from a deep loss to close up...

