Broad Market Outlook for February 13, 2018
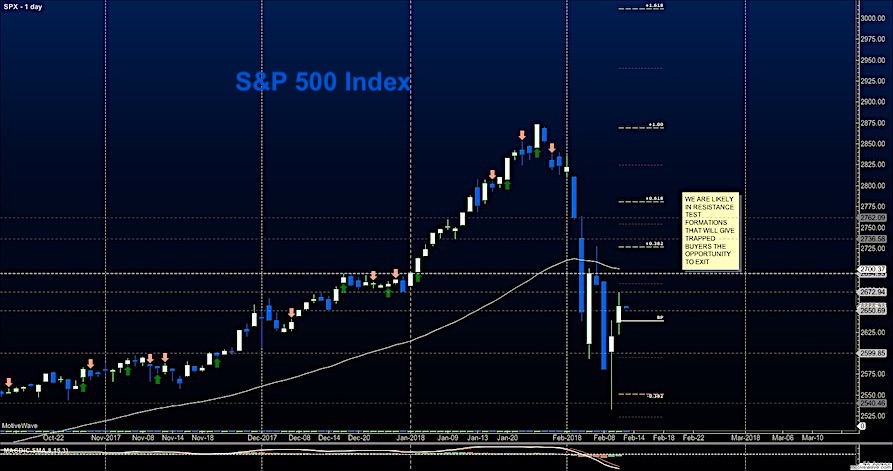
Cross currents are bringing choppy action as price resistance formations form. Traders need to be careful with buying extended moves in this environment as there will be trapped buyers in the mix of contention (looking to sell into each move higher).
If you’re long, watch for higher support to hold as an indication of buying strength building below.
S&P 500 Futures
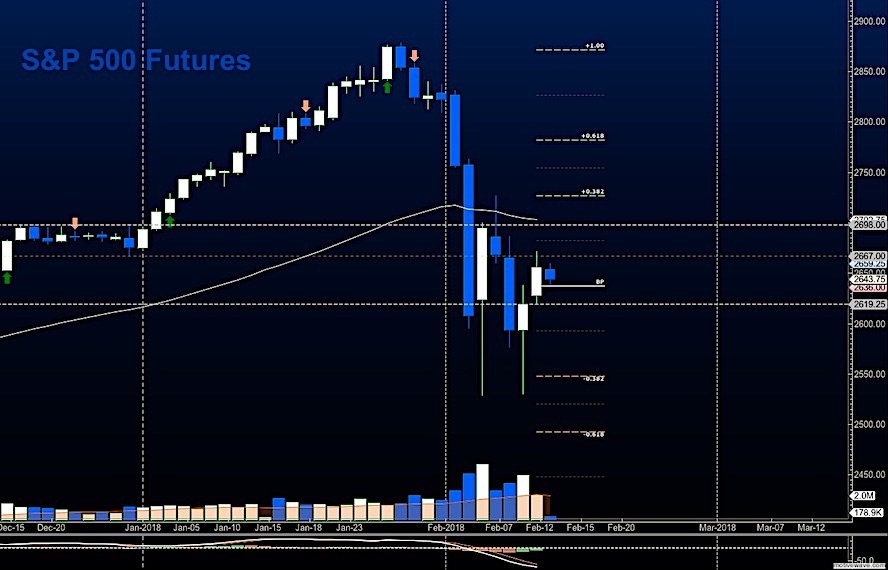
Resistance sits near 2667 and a breach here opens the test of 2700. Holding higher support regions near 2619 will be critical for the traders hoping for a bounce to solidify. These are resistance test formations so buying extended moves upward will open larger risk events if you intend to hold the trade. The bullets below represent the likely shift of trading momentum at the positive or failed retests at the levels noted.
- Buying pressure intraday will likely strengthen with a positive retest of 2667.75
- Selling pressure intraday will likely strengthen with a failed retest of 2636
- Resistance sits near 2649.75 to 2666.75, with 2699.25 and 2720.5 above that.
- Support sits between 2636.5 and 2620.75, with 2609.25 and 2577.5 below that.
NASDAQ Futures
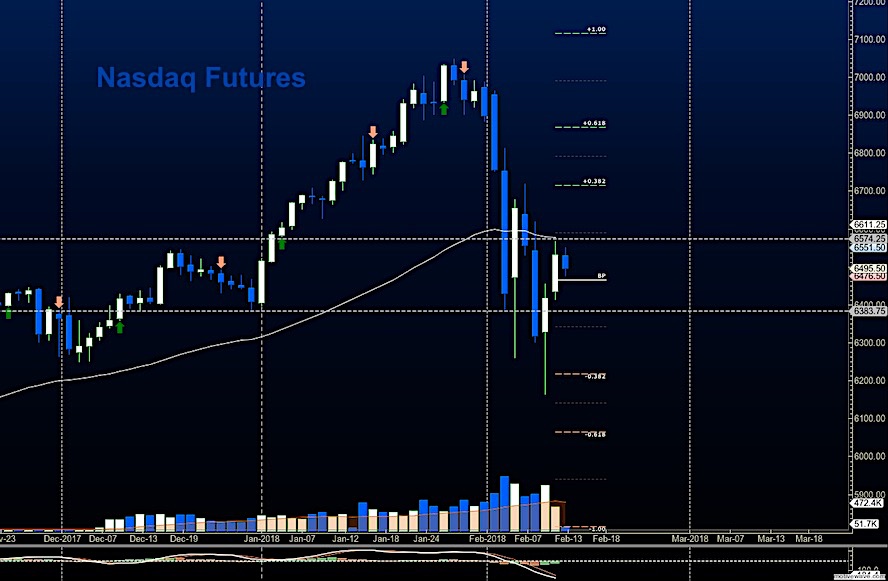
Momentum continues as mixed with recovery a little stronger than the ES_F at this time. Buyers now have to either hold higher support near 6384 or breach and hold regions above 6574 to continue the recovery in the charts. Ranges are wide but still tightening in the resistance test formations here. The bullets below represent the likely shift of intraday trading momentum at the positive or failed tests at the levels noted.
- Buying pressure intraday will likely strengthen with a positive retest of 6574.75
- Selling pressure intraday will likely strengthen with a failed retest of 6476
- Resistance sits near 6549 to 6574.25 with 6611.5 and 6674.5 above that.
- Support sits between 6476.5 and 6430, with 6384 and 6304.5 below that.
WTI Crude Oil
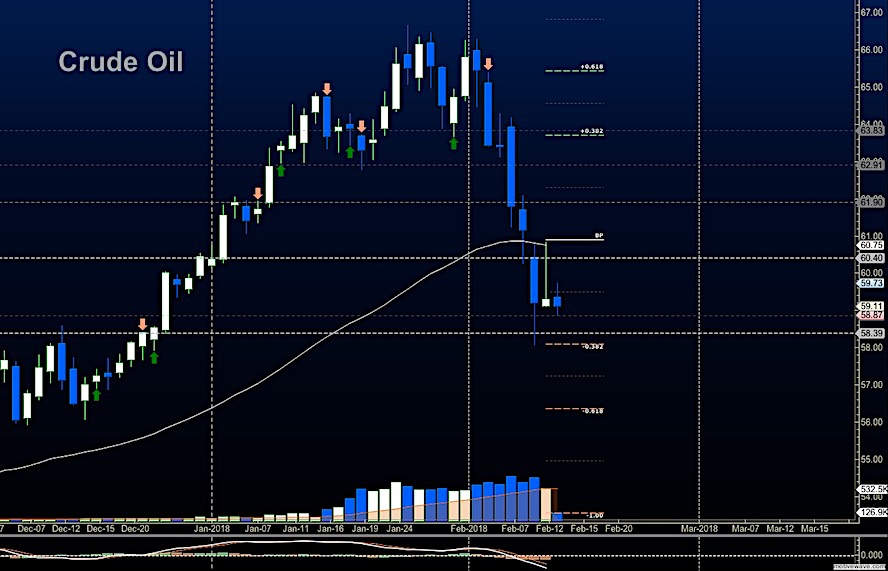
API after the close. Traders pushed WTI crude deep into support territory once again and now 60 looms as resistance in the current formation. Sellers will hold dominion over the chart as they do in the current space until we breach and retest this level. The bullets below represent the likely shift of intraday trading momentum at the positive or failed tests at the levels noted.
- Buying pressure intraday will likely strengthen with a positive retest of 60.75
- Selling pressure intraday will strengthen with a failed retest of 58.8
- Resistance sits near 59.7 to 60.40, with 60.75 and 61.72 above that.
- Support holds near 59.04 to 58.87, with 58.39 and 57.4 below that.
If you’re interested in the live trading room, it is now primarily stock market futures content, though we do track heavily traded stocks and their likely daily trajectories as well – we begin at 9am with a morning report and likely chart movements along with trade setups for the day.
As long as the trader keeps himself aware of support and resistance levels, risk can be very adequately managed to play in either direction as bottom picking remains a behavior pattern that is developing with value buyers and speculative traders.
Twitter: @AnneMarieTrades
The author trades stock market futures every day and may have a position in mentioned securities at the time of publication. Any opinions expressed herein are solely those of the author, and do not in any way represent the views or opinions of any other person or entity.

: Cup (and Maybe Handle) Watch")
 Trading Near Top Of Price Range")

