The recent correction in U.S. stock indices is on par with expectations we described last October. Now we highlight some supports and targets to watch in the iShares Russell 2000 ETF (NYSEArca: IWM) with an overall bullish expectation into summer.
Assuming our support levels hold, this serves as a Russell 2000 Elliott wave forecast for 2018… including new highs. Also, be sure to check out the special subscription offer described at the end of this post.
For several months we have been expecting an intermediate degree fourth wave to manifest within the upward Elliott wave pattern segment that began in early 2016. The sharp decline of the past two weeks probably represents the first part of that fourth wave, with additional choppy consolidation expected in coming months.
Although the consolidation should resolve in an upward breakout to reach a new IWM high, we continue to believe the larger upward segment from 2016 represents the end of the bull market that has persisted since 2009. The completion of wave [v] of ‘5’ should would mark the top. It is very difficult to calculate the timing for an important market top, so bullish traders should be diligent about protecting their positions when the market eventually tests or exceeds last month’s highs.
Russell 2000 Elliott Wave Forecast: Monthly & Weekly Bar Charts
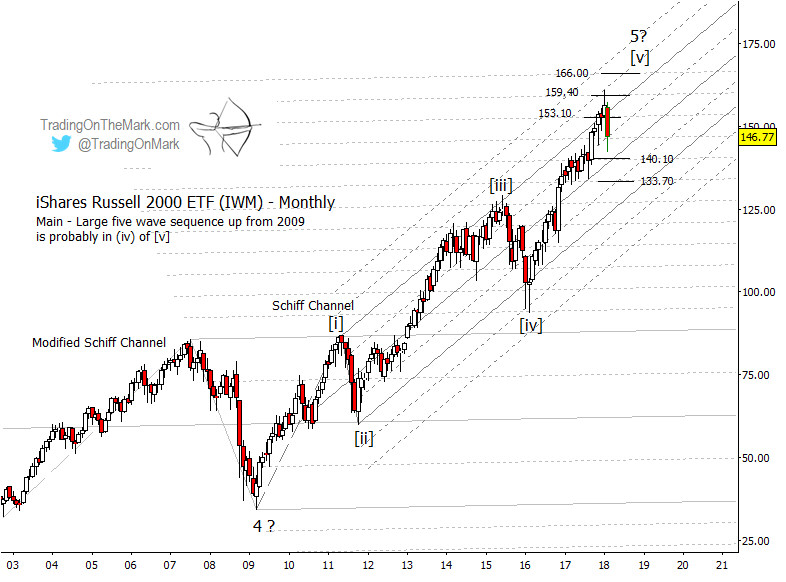
Looking first at the monthly Elliott wave chart, the rally from 2016 climbed higher than the resistance areas we showed last autumn, actually testing the upper 1/4 harmonic of the steep Schiff channel. This offers some symmetry with the preceding wave [iv] which tested the corresponding lower 1/4 harmonic two years ago.
The price of the Russell 2000 is paying attention to the larger modified Schiff channel that is shown in a lighter color on the monthly chart below. Throughout the climb from 2009, the Russell 2000 ETF (IWM) has moved upward and downward in quantum steps corresponding to the 1/8 harmonics of that larger channel. Looking upward from the present area, the nearby resistance harmonics are near 153.10, 159.40, and 166.00. Each of those levels can act as an “attractor” when price breaks in either direction from minor consolidations.
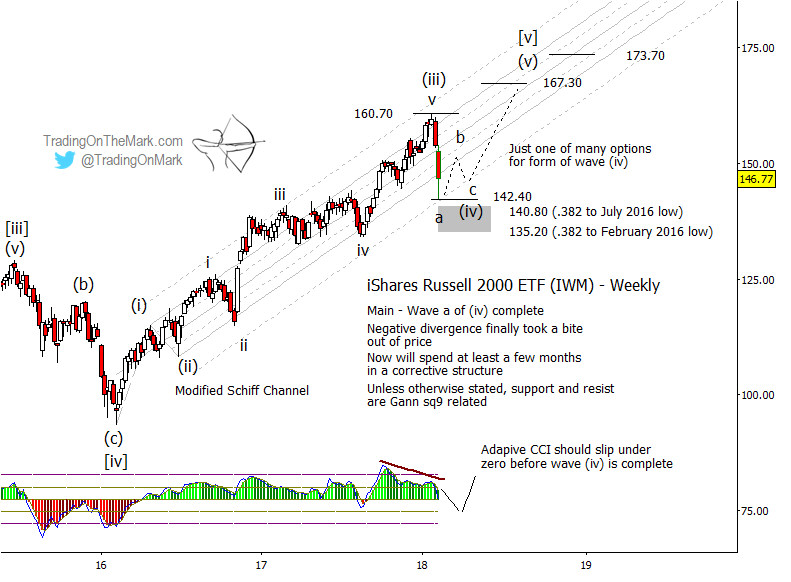
A Russell 2000 weekly chart offers more guideposts for traders to calibrate their remaining entries and exits in this market. The recent decline halted near the lower 1/2 harmonic of the channel that has been guiding the rally from 2016, and it came very close to testing the Gann square-of-nine support at 142.40.
An additional support zone extends from approximately 140.80 to 135.20 based on standard Fibonacci retracement measurements. Elliott wave allows for the next sub-waves of wave (iv) to move into that zone, but it is also possible that the correction could form a contracting range without producing a lower low.
As price moves upward to trace the final wave (v) of [v] of ‘5’ it must overcome the Gann resistance that capped wave (iii) at 160.70. The next prominent Gann levels to watch are 167.30 and 173.70, and we believe they can be tested during summer or autumn of this year. In addition to monitoring IWM reactions to the precise resistance levels, traders should watch a momentum indicator such as the adaptive CCI we have included on the weekly chart. A negative divergence corresponded with the peak of wave (iii), and we would expect to see a similar or larger divergence at the conclusion of wave (v).
This month we’re offering a new kind of subscription incentive. If you’re interested in our Daily Analysis service but you’d also like to get a peek at intraday trading action, then you’ll like this opportunity! Just start a new Daily Analysis subscription during February and we’ll give you access to our intraday trading room for three full weeks as a bonus. It’s a great way to see how we approach the trades on a faster time frame, especially with equity indices.
Twitter: @TradingOnMark
No position in any of the mentioned securities at the time of publication. Any opinions expressed herein are solely those of the author, and do not in any way represent the views or opinions of any other person or entity.

: Creating Bullish Divergence?")


: Creating Bullish Divergence?")

