A year ago we wrote that the Russell 2000 Index (INDEXRUSSELL:RUT) and its related iShares Russell 2000 ETF (NYSEARCA:IWM) appeared to be developing topping patterns.
That view is still our primary scenario with the Russell and other indices.
However, the fact that a whole year has elapsed without the anticipated reversal illustrates one of the basic principles of Elliott wave trading. As we monitor the formation of the topping pattern, we aren’t actually trying to catch the top. Instead we’re watching for clues in the way price behaves with respect to patterns and levels that will tell us when the environment will become safer for short positions and more hostile to long positions.
For now, we believe the index can climb still higher, although it might see a modest correction during the next several weeks.
Using the monthly chart for the iShares Russell 2000 ETF (IWM) to stand in for the index, we are trying to discern when the upward move from the landmark lows of early 2016 will be complete. The move should consist of a five-wave structure, and indeed the price action of the past year has illuminated part of that Elliott wave structure.
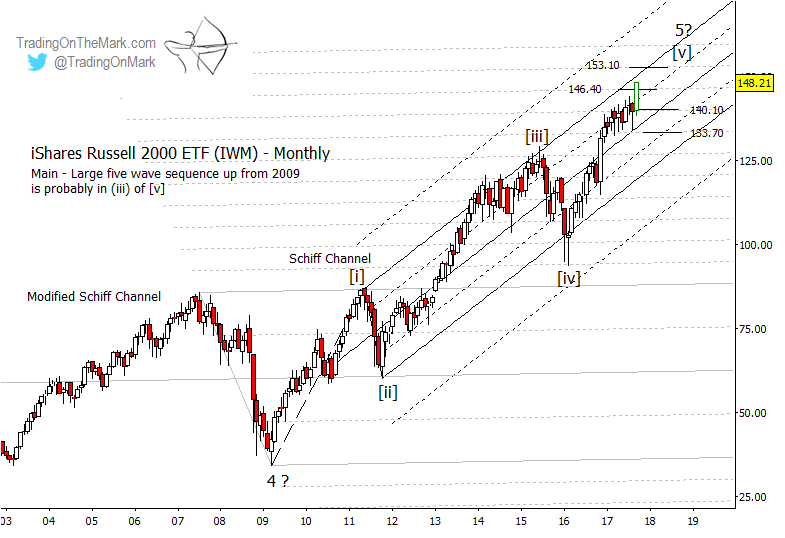
The monthly chart shows how IWM has climbed a “ladder” of harmonics associated with a long-term modified Schiff channel (light gray) even as price has mostly stayed contained within the boundaries of a steeper Schiff channel (dark gray). The Russell 2000 ETF is currently testing resistance near 146.40, and beyond that 153.10 represents the next higher area where a modest correction could begin.
The developing Elliott wave structure and diverging momentum are easier to see on a IWM weekly chart. The rise from early 2016 appears to have put in waves (i), (ii) and most of wave (iii) of the final segment. A wave (iv) correction this autumn could reach down to test near the prior low that was sub-wave ‘iv’ of (iii), and it might even reach as far as the internal quarter harmonic of the channel shown below.
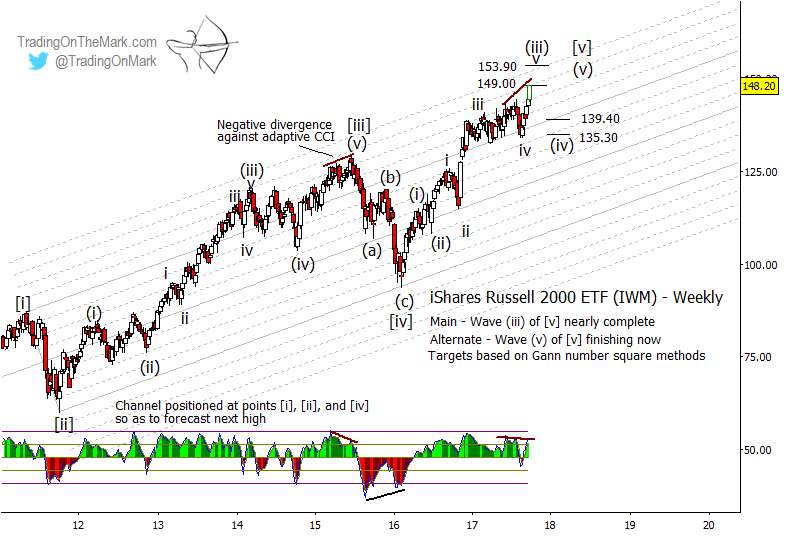
Our primary scenario favors the idea that IWM will bounce out of the expected correction to make a new high, and the bounce might represent an viable trade for the trader who achieves a good entry. On the other hand, it is also possible to count the rise from early 2016 as possibly being near completion, so the risks for IWM bulls in the remainder of 2017 are more significant than they were during other stages of the lengthy rally.
The strength of the next downward move will clarify whether it is a correction or the start of something larger.
Visit our website and follow us on Twitter to keep up with the latest charts and forecasts.
The author does not have a position in any of the mentioned securities at the time of publication. Any opinions expressed herein are solely those of the author, and do not in any way represent the views or opinions of any other person or entity.
ALSO READ: Consumer ETF (XLY): Elliott Wave Shows Upside Into Year-End


 Testing Important Price Support")


