Although we may see some additional turbulence in U.S. equity markets during the first half of September, we caution traders not to fall prey to extremes of sentiment on either the bullish or bearish side. Modest trades can be profitable if executed carefully. But the larger Elliott wave picture is telling us to look for opportunities.
Some charts of the Consumer Discretionary SPDR ETF (NYSEArca:XLY) reveal a support area that will probably hold in the near term, and they also show the broad theme we expect for stock indices more generally this autumn.
With the Consumer ETF (XLY) specifically, traders might consider using the support area at current price levels and slightly lower as a backstop for potential long trades. The same area can be thought of as a challenge that market bears would have to beat before readers here should consider any short trades in the Consumer Discretionary ETF.
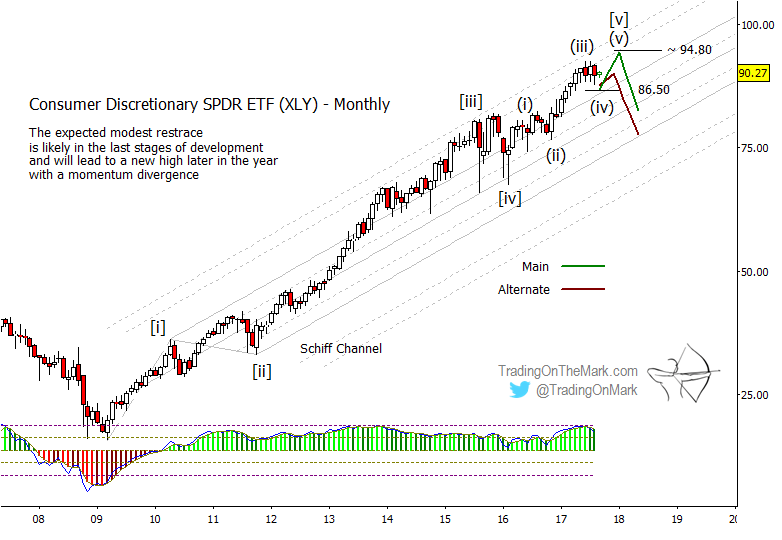
The choppy, corrective pattern XLY displayed during the summer counts best as an Elliott wave 4 in the upward progression from the landmark lows of early 2016. A typical Fibonacci 38.2% retracement of the prior upswing would put support near 86.50, which XLY has approached but not yet tested. A test of that area or the main channel boundary that is just slightly lower will probably offer a platform for a rally to modestly higher highs later this year.
We have illustrated the near-term bullish scenario with the green path on the charts below. It is currently our primary scenario.
Consumer Discretionary Elliott Wave Counts – $XLY monthly chart
Although we favor the bullish path, we also must consider a bearish alternate scenario that shows how a market top might already be in place. The Elliott wave count supporting that idea comes from treating the landmark fourth wave of 2016 as having persisted in a triangle formation throughout most of 2016. In that view, a five-wave move upward from the completion of wave [iv] would mean the entire upward pattern could be finished.
In order for the bearish case to move to the forefront, we would need to see at least a weekly close beneath the support area on the monthly chart and beneath the similar support area of 87.12 to 86.50 shown on the weekly chart.
Consumer Discretionary Elliott Wave Counts – $XLY weekly chart
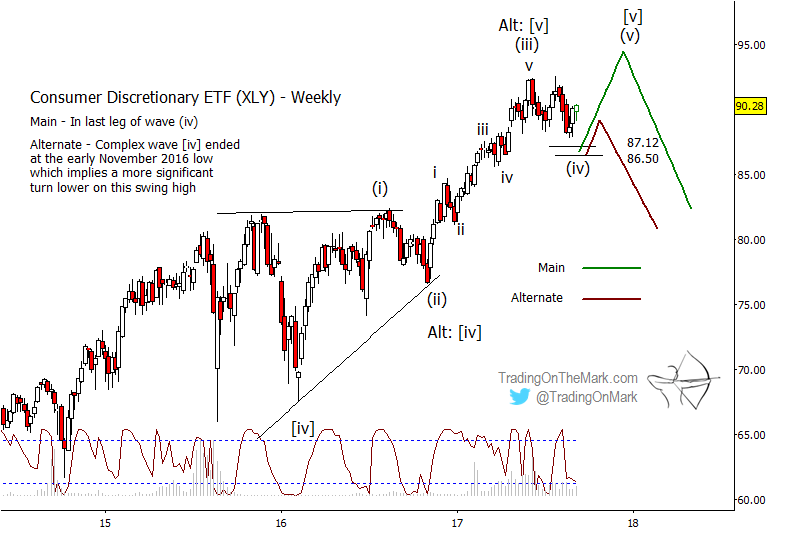
An important factor in favor of the bullish wave count is that we have not yet seen any negative divergence with the adaptive CCI momentum indicator on a monthly time frame. Normally that kind of divergence precedes a major top in anything as widely traded as XLY. Meanwhile, the Lomb periodogram cycle detection algorithm on the weekly chart suggests that prices are approaching a local low.
With the right guidance, a trader should be able to find some excellent opportunities in equity and currency moves this autumn. Visit our website and follow us on Twitter to keep up with the latest charts and forecasts.
The author does not have a position in any of the mentioned securities at the time of publication. Any opinions expressed herein are solely those of the author, and do not in any way represent the views or opinions of any other person or entity.
ALSO READ: Dow Transports ETF (IYT): A Bullish Setup Into Year-End
: All Energy Hands on Deck!")


: All Energy Hands on Deck!")