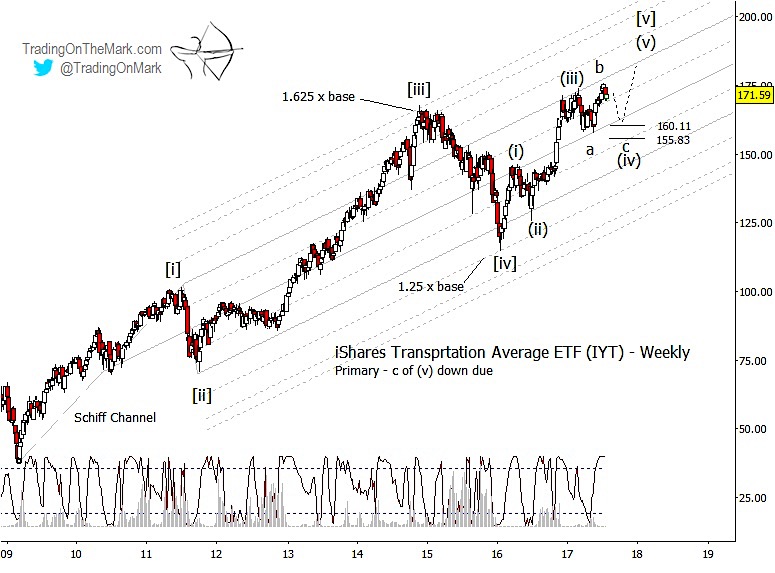
The transportation sector should provide some decent trading opportunities in coming months. We are particularly interested in the Elliott wave pattern we believe is emerging for the iShares Transportation Average ETF (NYSEARCA:IYT).
This post offers some thoughts about how to trade the Dow Transports ETF (IYT) from a bullish perspective.
We’re also developing a less bullish (even potentially bearish) alternate Elliott wave count for the Dow Transports ETF. Watch our Twitter account for that chart a bit later today or early tomorrow.
The idea that there might be two different interpretations of the pattern – a bullish and a bearish interpretation for example – shouldn’t scare traders away from this market. We’re now in an environment where cautious traders should be thinking about bearish contingencies in all sectors of equity markets. The value of Elliott wave analysis in these circumstances is to show traders where to look for evidence that their trade is working or failing.
Looking at the Dow Jones Transports ETF (IYT) on a weekly time frame, the recovery from the 2009 low presents as a five-wave impulsive structure. That suggests that the current segment of the rally also should be forming five-wave structure, which seems to be the case with the rally from the early 2016 low.
Did the recent surge upward from May 2017 mark the top? Technically it’s possible, but upward momentum is still strong in this and other sectors. Ideally the fifth wave of the current impulse would look better if it was larger and more commensurate with the size of wave (i). We think the surge looks better as the middle part of a fourth-wave correction… or possibly the first leg of what could become an extended upward fifth wave. (The latter scenario is what we plan to examine in our alternate chart.)
To trade this scenario from a bullish standpoint, a trader would watch for the final part of wave (iv) to test support areas that would work to complete sub-wave ‘c’ of (iv). Based on Fibonacci relationships with sub-wave ‘a’, the most likely support areas are near 160.11 and 155.83. That’s the zone where a bullish trader would watch for entry signals on a smaller time frame, and it also suggests where the safety stops should go.
If price bounces after a more shallow decline, that might favor the idea that wave (v) has already begun, with the rally from May being the first of five sub-waves. That alternate (still bullish) scenario might be more difficult to trade because the entry signals would be more difficult to detect, and the allowance for stops would have to be wider. Even so, if we see evidence that IYT is already making an upward impulse, that gives us a framework for calculating the resistance areas where the impulse might finish. That in turn would help a bearish trader find a setup.
There are a lot of good trades to catch this summer. Keep up with the turns by following us on Twitter @TradingOnMark and on facebook. Thanks for reading.
The author does not have a position in any of the mentioned securities at the time of publication. Any opinions expressed herein are solely those of the author, and do not in any way represent the views or opinions of any other person or entity.


