September has presented traders with several warning signs of instability in equity and bond markets. So we are focusing our posts and our newsletter this week on developments in various stock market indices. We are especially interested in identifying signs of pattern completion and weakening momentum as stock market indices test various types of resistance, as those developments could precede the downward turn we are expecting.
We last visited the iShares Russell 2000 ETF (NYSEARCA:IWM) in early March 2016 when charted price areas where we thought a decline could accelerate. Fortunately our chart also showed the upward retracement level that would invalidate the downward scenario we were considering at the time. Soon after we posted the article, IWM rallied above the threshold price where last-resort stops should have been set.
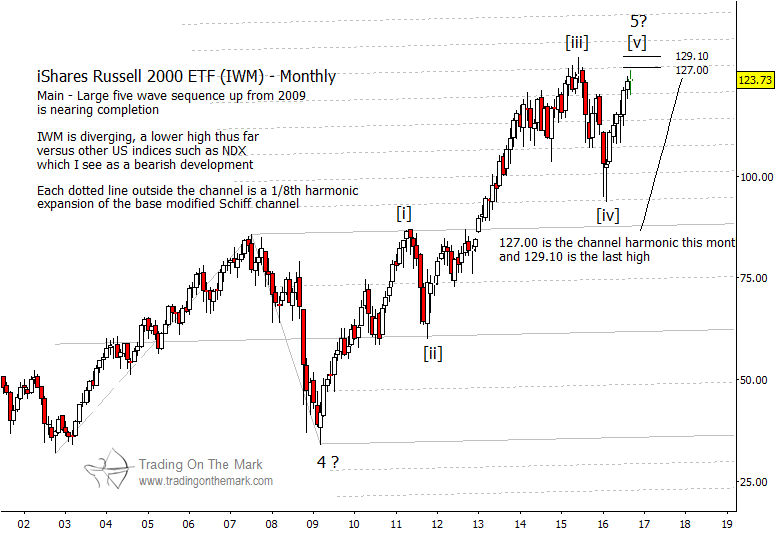
Because IWM failed to complete the five-wave impulsive move down that we had forecast, we were forced to consider that the whole decline was probably a corrective fourth wave in the established upward trend. Price action during the rest of the year has supported that idea. Now we are watching for completion of a satisfactory Russell 2000 topping pattern (IWM). And it appears to be on the verge of doing so (see charts below).
On a monthly chart, two important resistance areas to watch are near 127.00 and 129.10. The first level represents channel resistance that capped most of the market action in 2015, even though price poked briefly higher. The second level represents the actual price high in 2015. The most probable scenario has IWM reaching a new high before failing, which means that 129.1 should be tested and exceeded, even if only briefly.
However, there is also a small possibility that the main decline could begin even before the pattern is technically complete. That type of truncation of pattern can happen at major highs and major lows, especially when there is already divergence among different stock indices. Therefore, it will be important to monitor IWM price behavior at more than one resistance area.
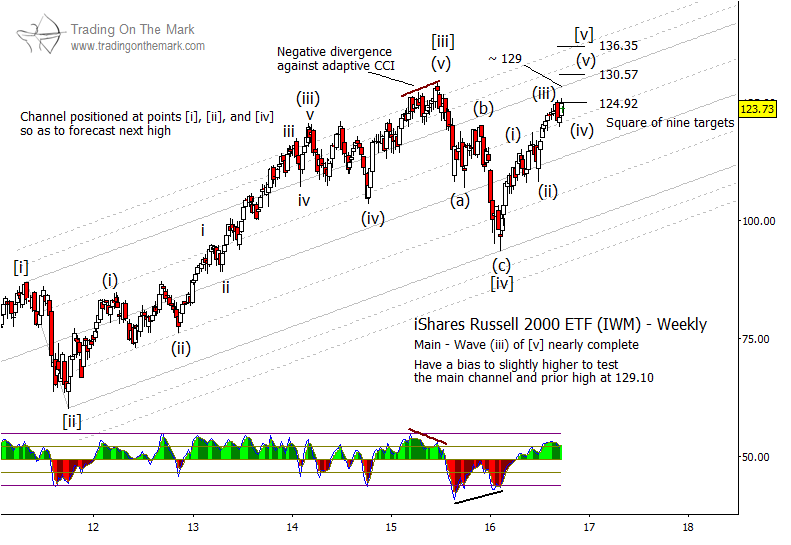
Ideally, the rally from March 2016 should consist of five sub-waves. As well, it should reach a new high above that of 2015. We are particularly watching some Gann square-of-nine resistance levels to identify the structure of this rally. The nearby level at 124.92 appears to have capped sub-wave (iii) of the sequence, and price may now be working on sub-wave (iv). Below is a weekly version of a prospective Russell 2000 topping pattern.
Also Read: Gold Chart Update: Time For A Correction?
A small rise into the next overhead target at 130.57 would fulfill the conditions for sub-wave (v) to complete the pattern, and it also would produce a modestly higher high above that of 2015. If price rallies more strongly than we currently expect in coming weeks, then the fallback square-of-nine level to watch as resistance is near 136.35.
There’s more! Our next email bulletin will focus U.S. equity indices. Request your copy via this link.
Thanks for reading.
Twitter: @TradingOnMark
No position in any of the mentioned securities at the time of publication. Any opinions expressed herein are solely those of the author, and do not in any way represent the views or opinions of any other person or entity.

 Rolling Over At Key Fibonacci Level?")


 Rolling Over At Key Fibonacci Level?")