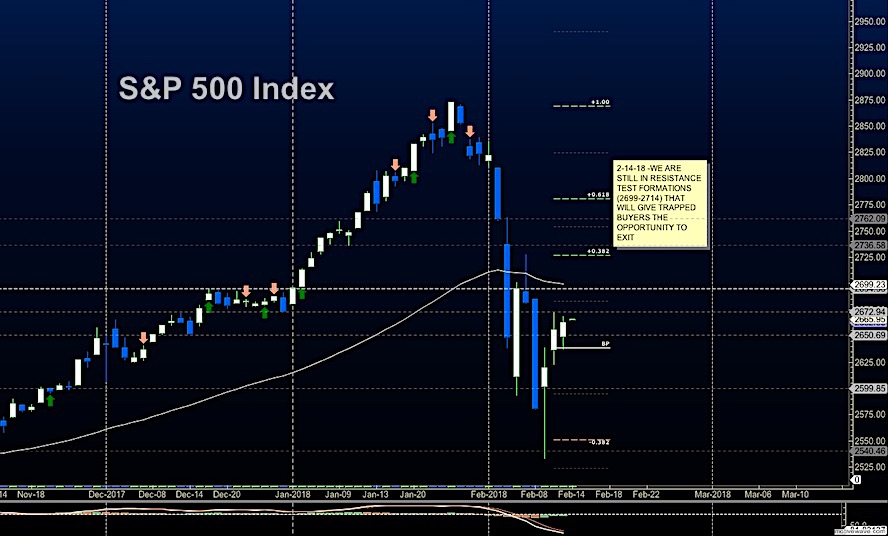
Broad Stock Market Outlook for February 14, 2018
Stocks are running into price resistance this morning as crosscurrents prevail. Pullbacks should find buyers, but traders will want to watch for higher price support levels to hold as an indication of buying strength continuing to build.
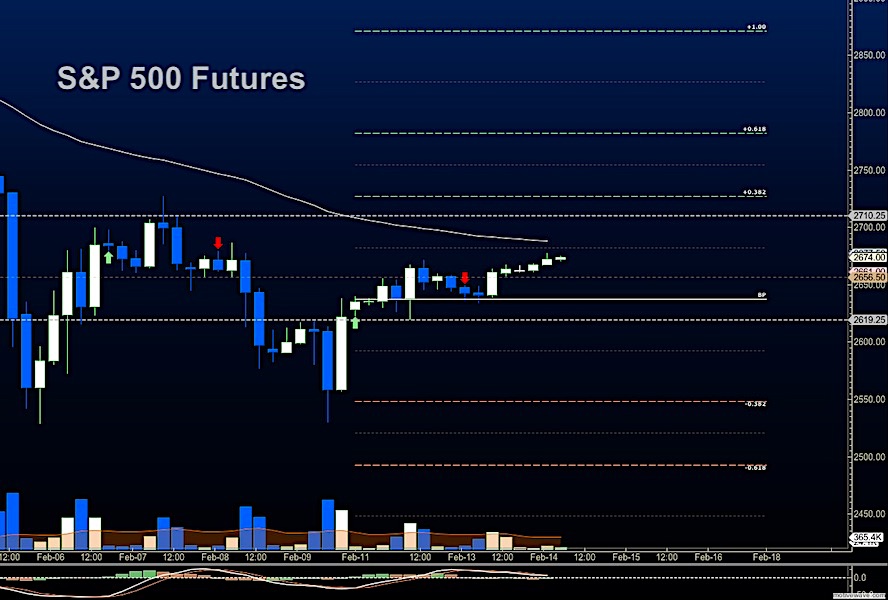
S&P 500 Futures
Resistance sits near 2667 was breached and a hold here opens the test of 2700. There is a line of sellers near 2684 stands in the way. Holding higher support regions near 2637 will be critical for the traders hoping for a bounce to hold. Buying the pullbacks will be the best bet – and, of course, exercising patience doing this. The bullets below represent the likely shift of trading momentum at the positive or failed retests at the levels noted.
- Buying pressure intraday will likely strengthen with a positive retest of 2679.75
- Selling pressure intraday will likely strengthen with a failed retest of 2636
- Resistance sits near 2677.75 to 2684.75, with 2697.25 and 2714.5 above that.
- Support sits between 2661.5 and 2636.75, with 2621.25 and 2597.5 below that.
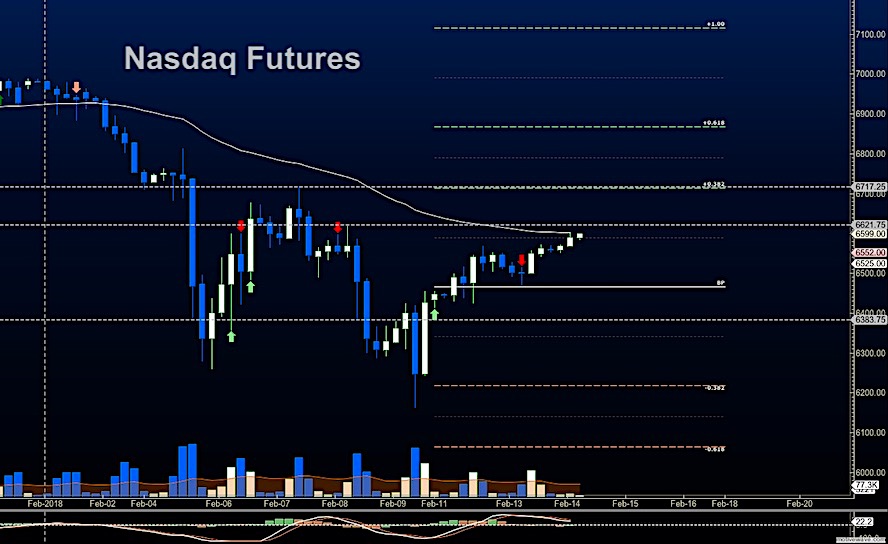
NASDAQ Futures
NQ_F- Momentum continues as mixed as traders recover. Buyers now have to either hold higher support near 6551.5 or breach and hold regions above 6621 to continue the recovery in the charts. Ranges are wide but buying pressure still holds steady. The bullets below represent the likely shift of intraday trading momentum at the positive or failed tests at the levels noted.
- Buying pressure intraday will likely strengthen with a positive retest of 6621.75
- Selling pressure intraday will likely strengthen with a failed retest of 6551
- Resistance sits near 6619 to 6674.25 with 6717.5 and 6762.5 above that.
- Support sits between 6525.5 and 6501, with 6467 and 6424.5 below that.
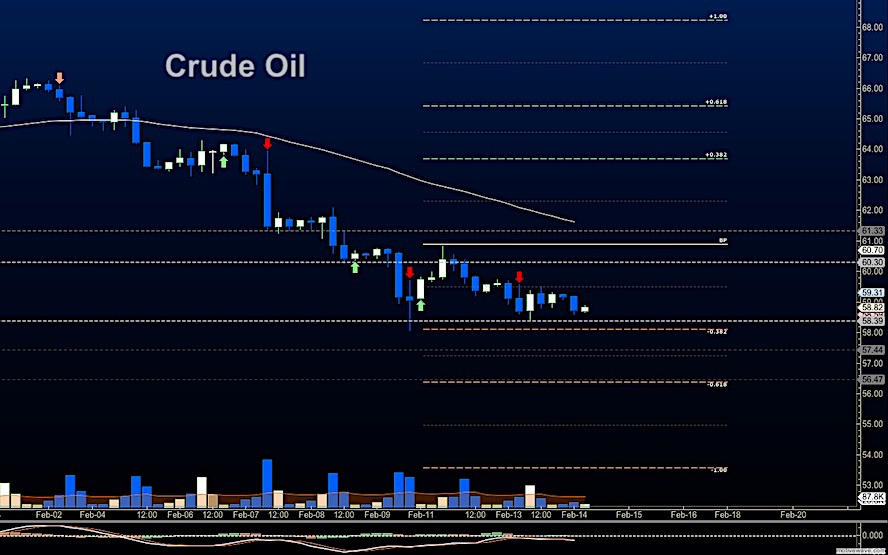
WTI Crude Oil
EIA at 10:30 ET. Traders pushed WTI crude even deeper into support territory once again with 59.7 as resistance. Shale production expansions clearly are affecting the mindset of the traders here. Sellers will hold dominion over the chart as they do in the current space until we breach 60.3. The bullets below represent the likely shift of intraday trading momentum at the positive or failed tests at the levels noted.
- Buying pressure intraday will likely strengthen with a positive retest of 60.3
- Selling pressure intraday will strengthen with a failed retest of 58.3
- Resistance sits near 59.3 to 59.7, with 60.3 and 60.78 above that.
- Support holds near 58.39 to 58.03, with 57.44 and 57.14 below that.
If you’re interested in the live trading room, it is now primarily stock market futures content, though we do track heavily traded stocks and their likely daily trajectories as well – we begin at 9am with a morning report and likely chart movements along with trade setups for the day.
As long as the trader keeps himself aware of support and resistance levels, risk can be very adequately managed to play in either direction as bottom picking remains a behavior pattern that is developing with value buyers and speculative traders.
Twitter: @AnneMarieTrades
The author trades stock market futures every day and may have a position in mentioned securities at the time of publication. Any opinions expressed herein are solely those of the author, and do not in any way represent the views or opinions of any other person or entity.


