Monday saw stocks continue the bounce that started on Friday. That day the S&P 500 rallied back from a deep loss to close up 86 points.
And on Monday morning, the S&P 500 (SPX) gapped higher to continue the rally. But market risks are still in the air.
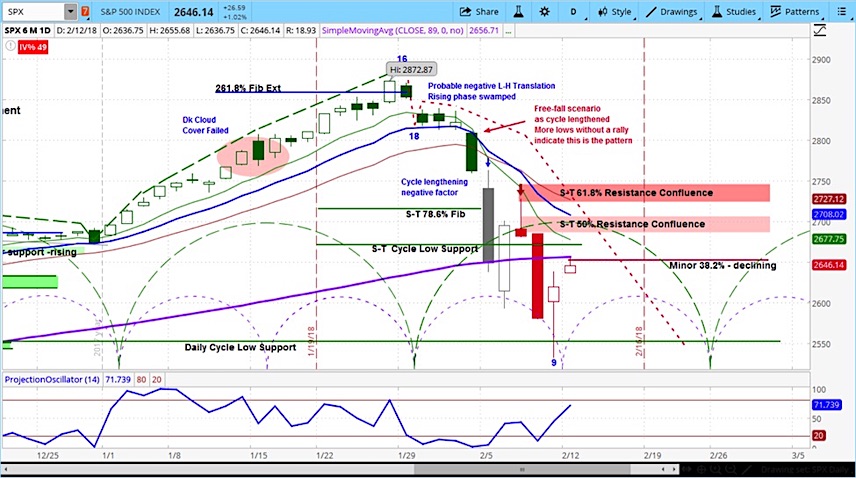
Let’s view this through the lens of cycle analysis. As you can see on the chart below, last week the S&P 500 (SPX) dove into a projected minor cycle low, which are designated by the purple dotted semicircles at the bottom, called “cycle brackets.” These are guides to cycle patterns.
And they are pointing to more stock market risks in the days and weeks ahead.
SPX Chart (Daily Bars)
As we explained in our most recent episode of the askSlim Market Week, it’s normal for a bounce to occur after this type of stock market correction.
However, this move is likely just a bounce. Upon testing the resistance levels between 2652 and 2676, we expect the declining phase of both the minor and major cycles to begin pushing the SPX lower once more. The major cycles are the green dotted cycle brackets.
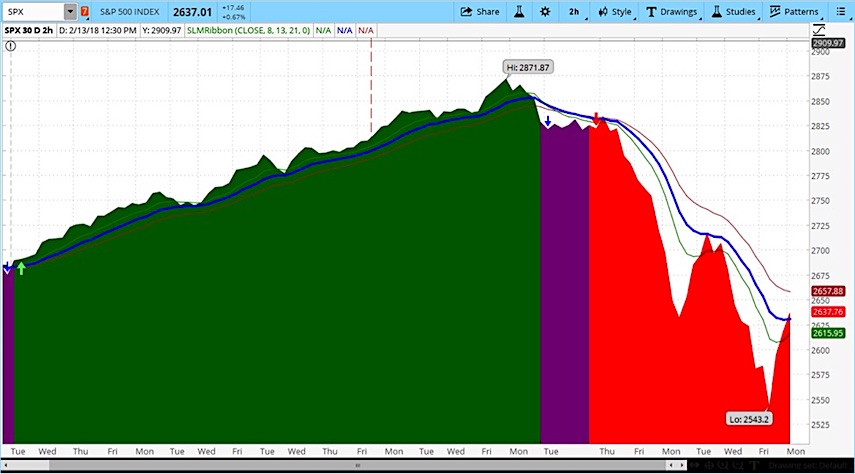
The chart below uses our favorite momentum indicator, “Slim Ribbons,” shown by the red, blue, and green moving averages. This indicates that short-term momentum is still negative, supporting a likely resumption to the downside.
2-Hour SPX Chart Over 30 Day Period
Taking a step back, our analysis of longer term cycles suggests that this is just the first leg of a declining phase of a larger cycle. In a clip from our member video below, we look at the monthly chart of the Dow Jones Industrial Average (DJI), which suggests that we are in period that could take the market lower into May, June, and July of 2018.
Big picture analysis on stocks – askSlim Special Presentation
Visit our site for more on our approach to using market cycles to analyze stocks.
Twitter: @askslim
Any opinions expressed herein are solely those of the author, and do not in any way represent the views or opinions of any other person or entity.


