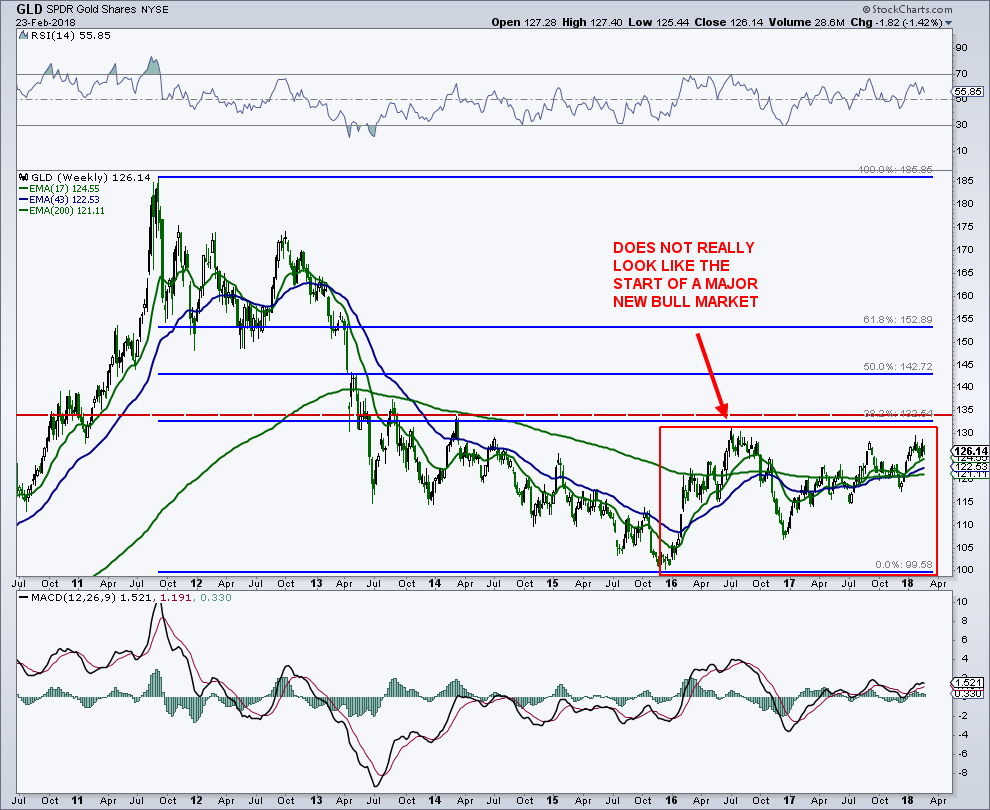
New Gold Bull Market Starting? Not So Fast…
Today, I want to provide a quick update on gold trading and the iShares Gold Trust (GLD). Gold has been meandering beneath major price...
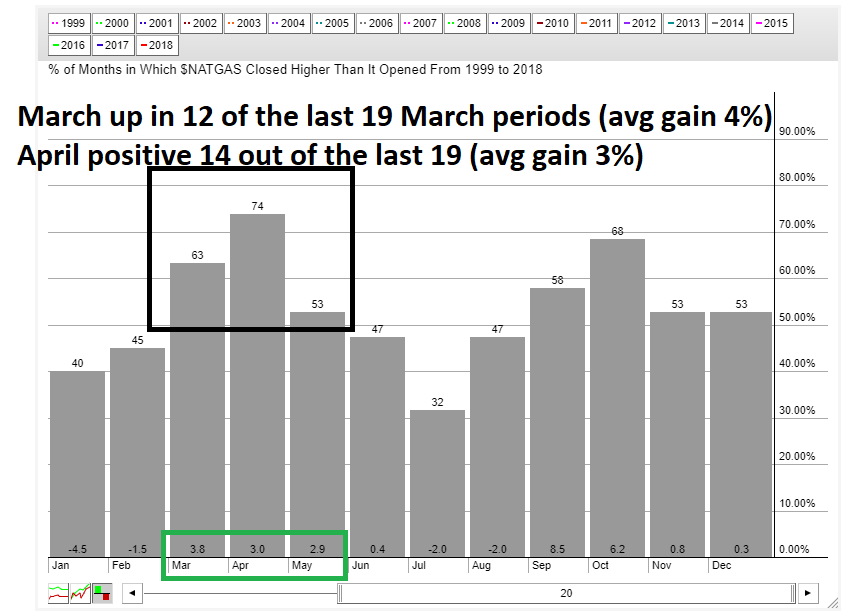
Natural Gas Seasonality Turns Bullish Into Spring Time
Natural gas prices dropped precipitously from Mid January into this week. I covered that in my article earlier this week.
Today I want to look...
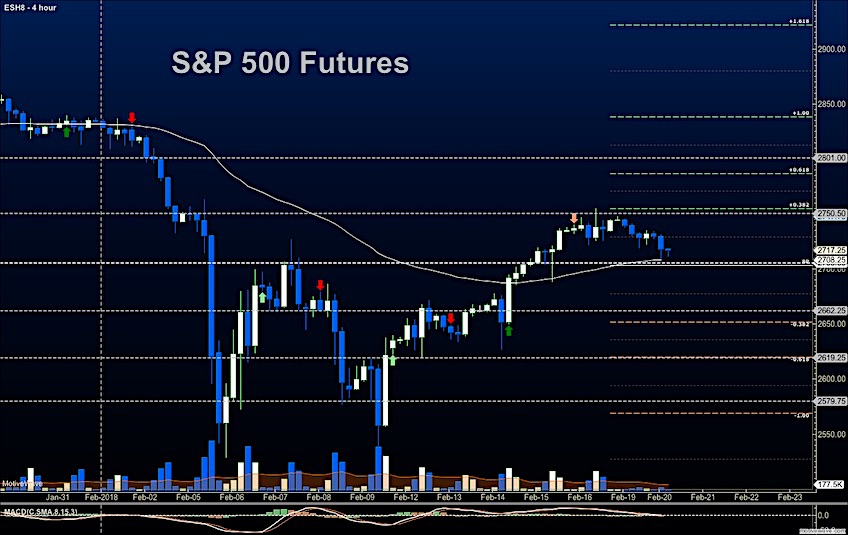
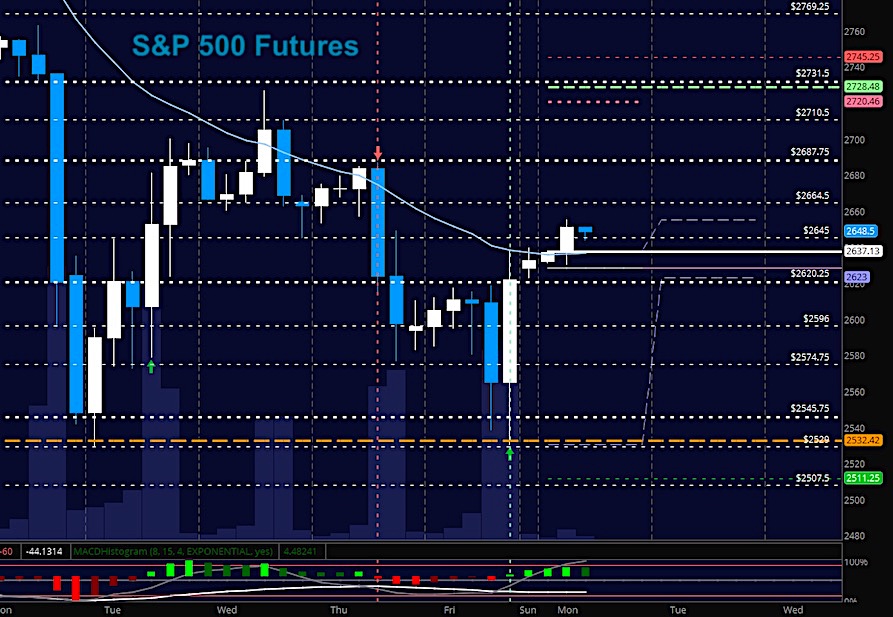
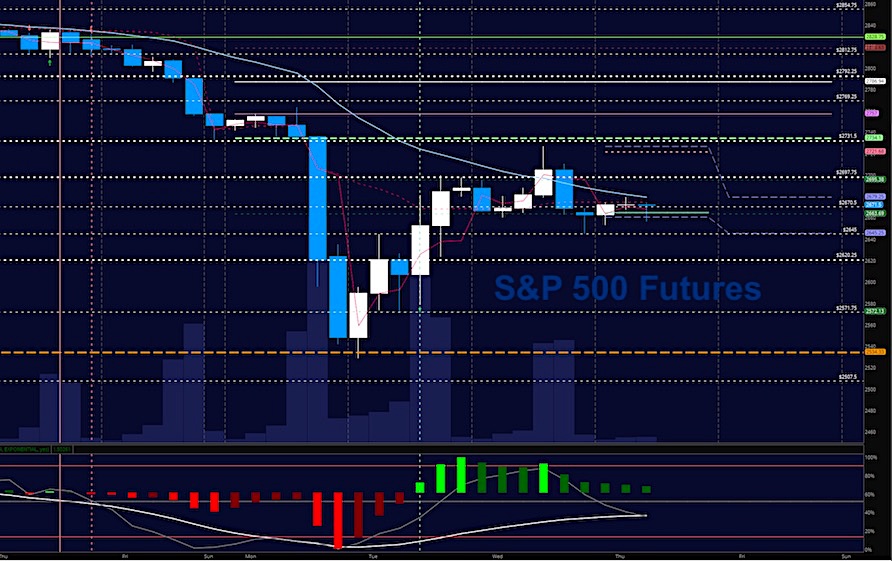
Stock Market Futures Trading Update For February 20
Broad Stock Market Outlook for February 20, 2018
The S&P 500 tested price resistance on Friday but could not overcome a key level. Now support levels...
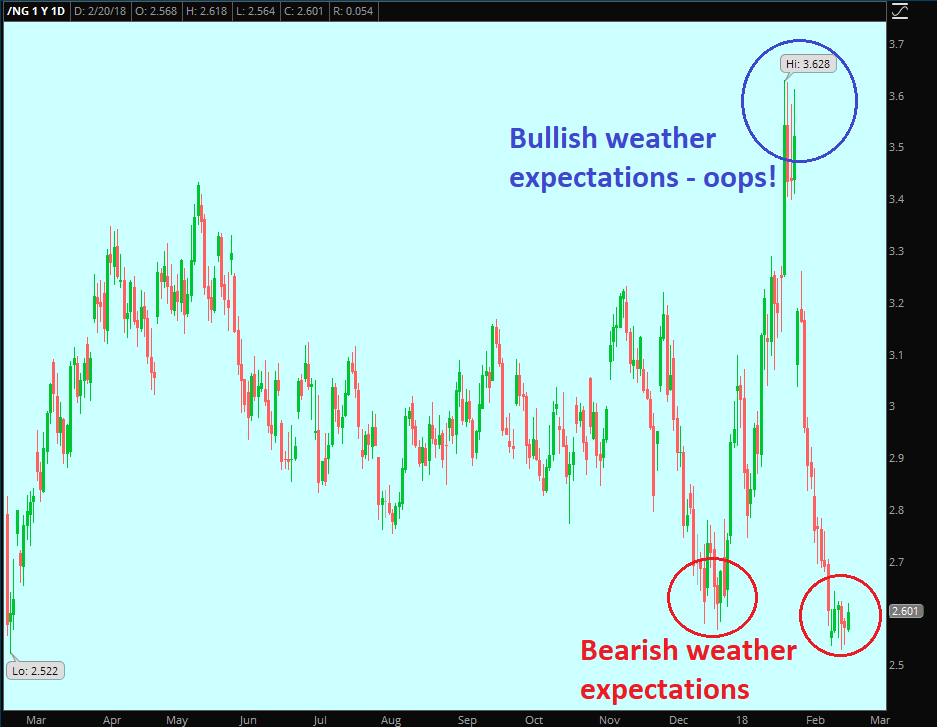
Natural Gas Hits Lowest Level Since 2016 as Mild Weather Persists
The March 2018 NYMEX natural gas contract fell $0.022 to close at $2.558/MMBtu on Friday last week.
The March contract for Natural Gas ended the...
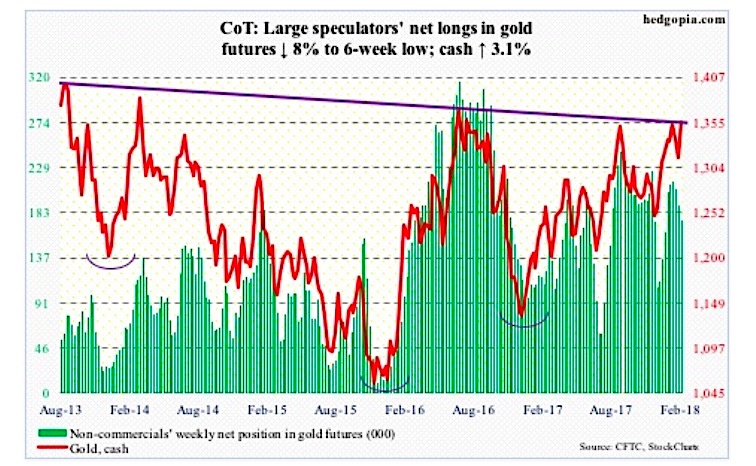
COT Report: Gold Bugs Have Golden Opportunity
The following chart and data highlight non-commercial commodity futures trading positions as of February 13, 2017.
This data was released with the February 16 COT...
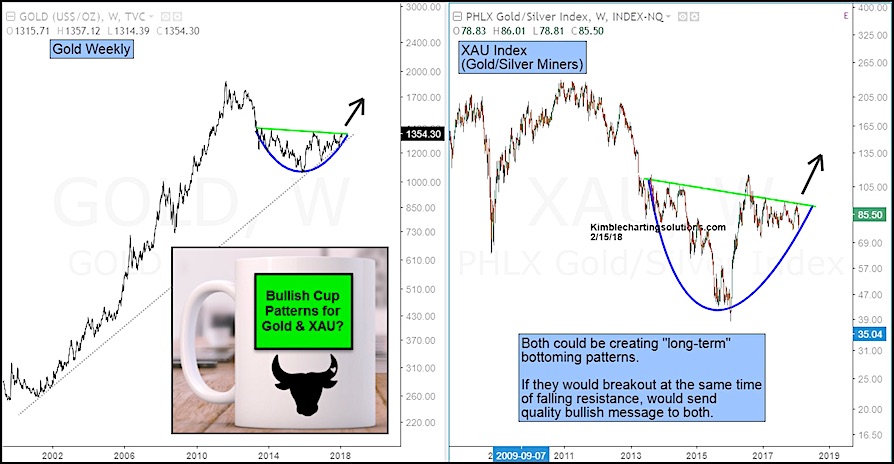
Opportunity Knocks… Will Gold Bulls Answer?
Gold investors have enjoyed a strong start to 2018.
After a brief pullback into early February, the shiny metal has charged higher once more.
The question...
Market Futures Trading Outlook For February 12
Broad Stock Market Outlook for February 12, 2018
The media quoted 'correction mode' in more articles than I can count but one day does not determine...
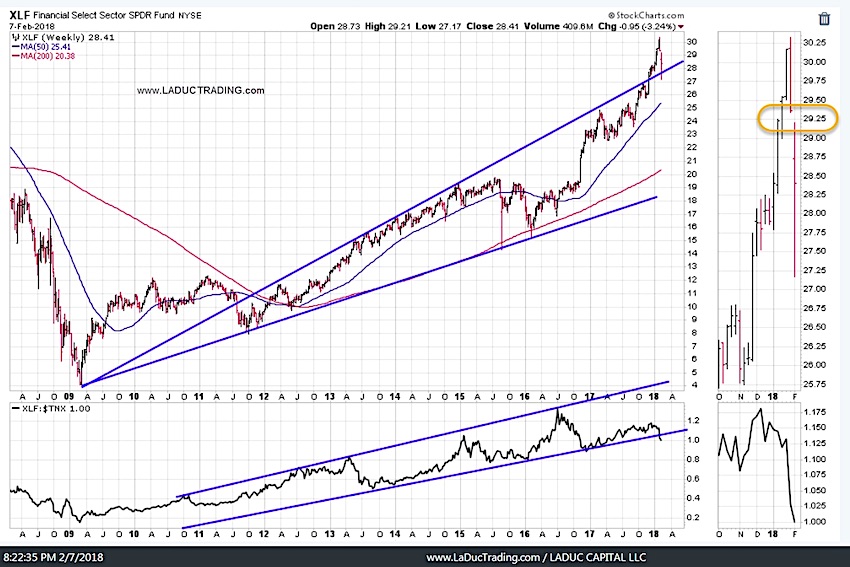
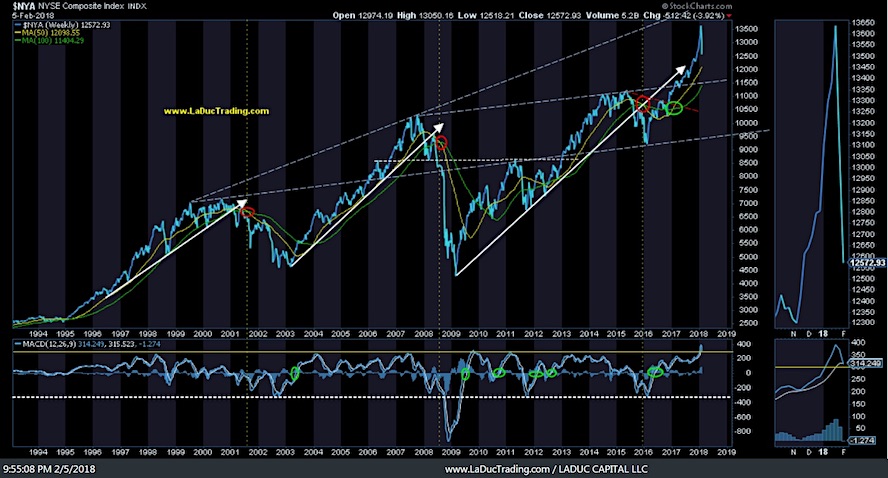
Intermarket Chart Attack: Not Done (Part 2)
This is an Intermarket Analysis chart review that I provided to my fishing club members Wednesday to prepare for the stock market downdraft I expect to continue.
These...
S&P 500 Futures Trading Update: 2720 Above 2620 Below
Broad Stock Market Outlook for February 8, 2018
The daily 50 simple moving average of the S&P 500 chart, as well as the weekly 10 simple moving...
Intermarket Chart Attack: Not Done
This is an Intermarket Analysis chart review that I provided to my fishing club members this past weekend which graphically represents relationships (strong and weak) that can...

