Broad Stock Market Outlook for February 8, 2018
The daily 50 simple moving average of the S&P 500 chart, as well as the weekly 10 simple moving average, held as resistance yesterday. We will be watching price resistance once again today as the market attempts to rally.
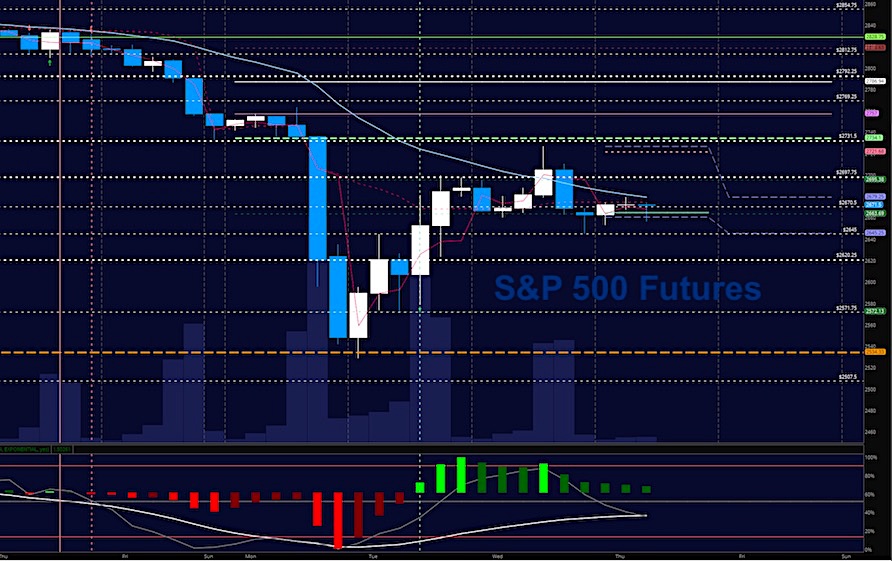
The 2720 area on S&P 500 futures is the price region to breach and hold if buyers are to recapture real control. Big money traders could easily be planning a recovery but may wait to see the hold of higher support this morning near 2620.25 or perhaps even 2571.75 but I would suspect the lows of the week have been met.
S&P 500 Futures
If buyers can’t hold higher support level bounces near 2645, we’ll have sellers in clear power. Momentum is now mixed as cross-currents of buyers and sellers sort through the levels near 2670. The bullets below represent the likely shift of trading momentum at the positive or failed retests at the levels noted.
- Buying pressure intraday will likely strengthen with a positive retest of 2702.75
- Selling pressure intraday will likely strengthen with a failed retest of 2645
- Resistance sits near 2674.75 to 2696.5, with 2721.25 and 2735.5 above that.
- Support sits between 2656.5 and 2635.5, with 2606.25 and 2571.5 below that.
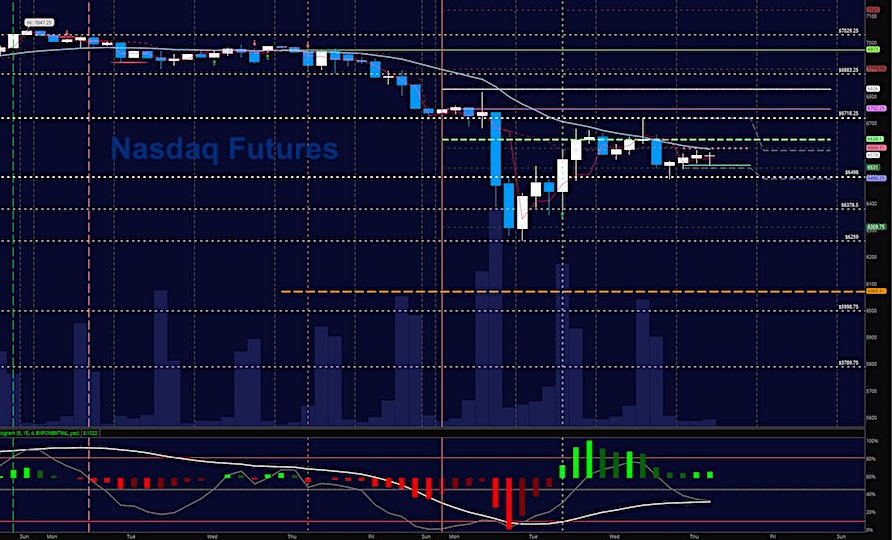
NASDAQ Futures
Momentum is also mixed here as traders try to continue the bounce off the prior day’s lows. Buyers now have to either hold higher support near 6378 or breach and hold regions above 6638 to continue the recovery in the charts. Ranges look like they will tighten for another day. The bullets below represent the likely shift of intraday trading momentum at the positive or failed tests at the levels noted.
- Buying pressure intraday will likely strengthen with a positive retest of 6638.5
- Selling pressure intraday will likely strengthen with a failed retest of 6483.5
- Resistance sits near 6610 to 6638.25 with 6679.5 and 6752.5 above that.
- Support sits between 6531.25 and 6490.5, with 6437.75 and 6384.25 below that.
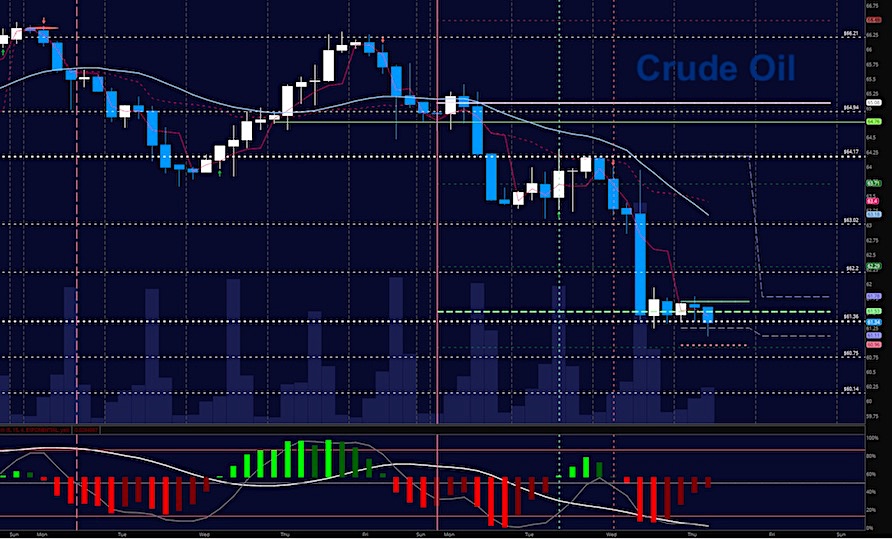
WTI Crude Oil
Traders fell into lower lows once again in a move to retest 60 or lower, I suspect. Trading is choppy this morning with momentum still drifting lower and likely taking us to lower price levels approaching 60. The bullets below represent the likely shift of intraday trading momentum at the positive or failed tests at the levels noted.
- Buying pressure intraday will likely strengthen with a positive retest of 61.86
- Selling pressure intraday will strengthen with a failed retest of 61.24
- Resistance sits near 61.7 to 62.04, with 62.68 and 63.02 above that.
- Support holds near 61.3 to 60.96, with 60.52 and 60.02 below that.
If you’re interested in the live trading room, it is now primarily stock market futures content, though we do track heavily traded stocks and their likely daily trajectories as well – we begin at 9am with a morning report and likely chart movements along with trade setups for the day.
As long as the trader keeps himself aware of support and resistance levels, risk can be very adequately managed to play in either direction as bottom picking remains a behavior pattern that is developing with value buyers and speculative traders.
Twitter: @AnneMarieTrades
The author trades stock market futures every day and may have a position in mentioned securities at the time of publication. Any opinions expressed herein are solely those of the author, and do not in any way represent the views or opinions of any other person or entity.
: Creating Bullish Divergence?")


 and Semiconductors (SMH): Concerning Price Pattern?")


