Broad Stock Market Outlook for February 12, 2018
The media quoted ‘correction mode’ in more articles than I can count but one day does not determine a trend. The bounce off Friday’s lows has advanced into resistance and the weight of recovery sits clearly on the shoulders of the traders trying to breach Thursday’s congestion areas.
Crosscurrents on the S&P 500 seem likely to prevail today. This makes attention to risk exposure even more important than usually. Trading ranges seem likely to tighten.
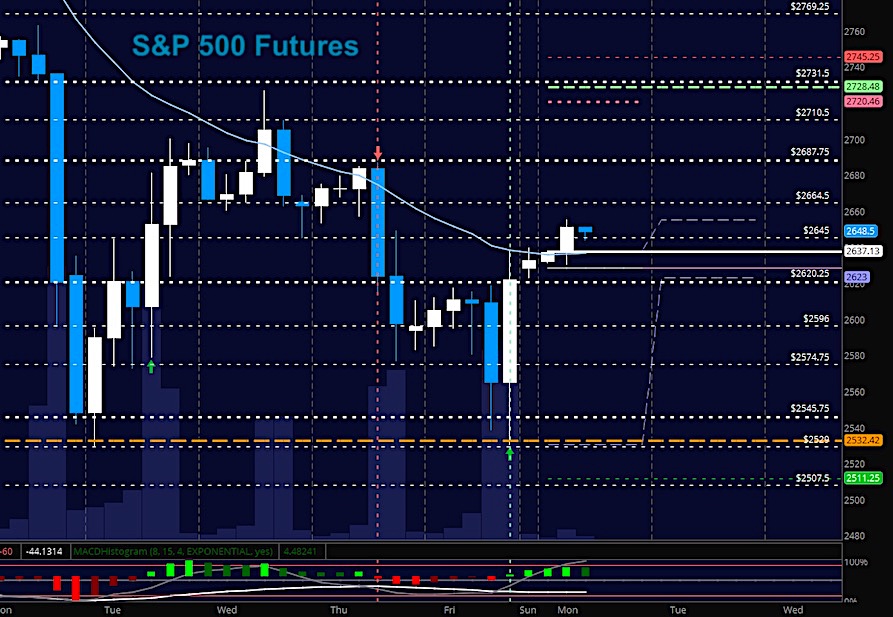
S&P 500 Futures
Even as we have bounced more than 400 ticks off the Friday low, momentum remains mixed as cross-currents of buyers and sellers now sort through the levels above 2636. Holding support regions near 2609 will be critical for the traders hoping for a bounce to solidify and breaching 2651 will be a battle as sellers are clearly camped there for now. The bullets below represent the likely shift of trading momentum at the positive or failed retests at the levels noted.
- Buying pressure intraday will likely strengthen with a positive retest of 2687.75
- Selling pressure intraday will likely strengthen with a failed retest of 2623
- Resistance sits near 2649.75 to 2664.5, with 2687.25 and 2720.5 above that.
- Support sits between 2636.5 and 2623, with 2609.25 and 2574.5 below that.
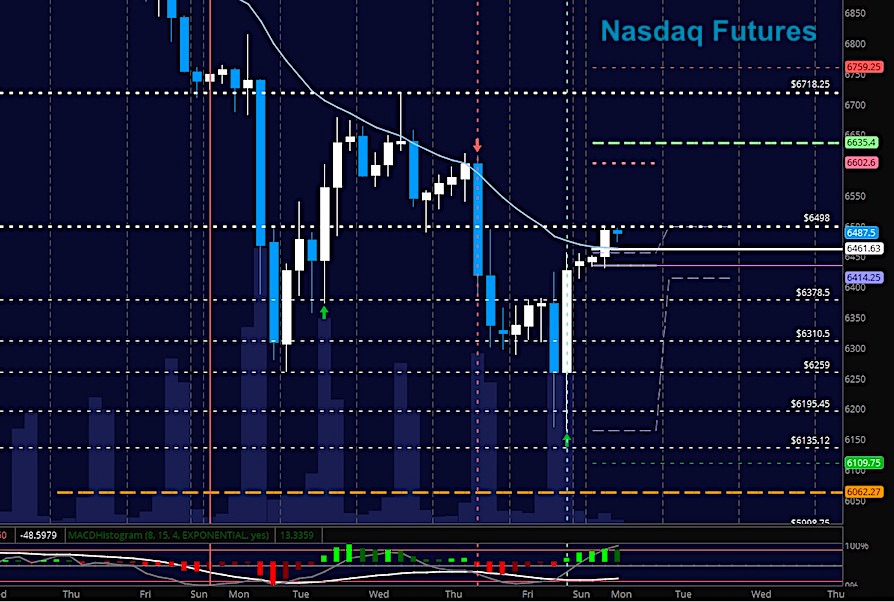
NASDAQ Futures
Momentum is also mixed here but a bit more bearish as we broke to new lows before attempting the current bounce formation. Buyers now have to either hold higher support near 6378.5 or breach and hold regions above 6498 to continue the recovery in the charts. Ranges are wide and negative drift prevails. The bullets below represent the likely shift of intraday trading momentum at the positive or failed tests at the levels noted.
- Buying pressure intraday will likely strengthen with a positive retest of 6498
- Selling pressure intraday will likely strengthen with a failed retest of 6427.5
- Resistance sits near 6498 to 6541.5 with 6601.5 and 6737.5 above that.
- Support sits between 6434.25 and 6414, with 6378.75 and 6310.5 below that.
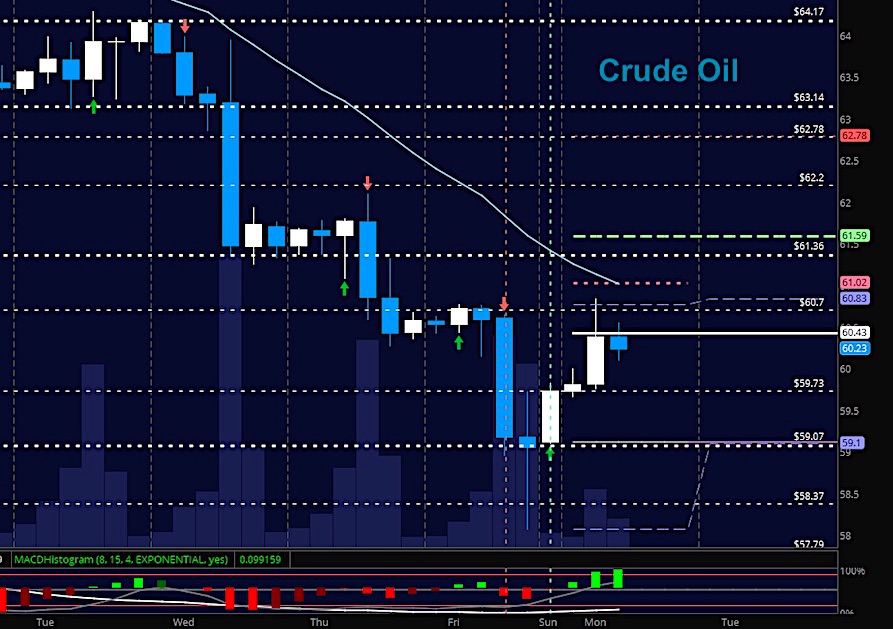
WTI Crude Oil
Traders pushed WTI crude deep into support territory before bouncing into support just above 60 this morning. We should see some kind of recovery attempt here but until we create formations that give us the combination of higher lows and higher highs, sellers will hold dominion over the chart as they do in the current space. The bullets below represent the likely shift of intraday trading momentum at the positive or failed tests at the levels noted.
- Buying pressure intraday will likely strengthen with a positive retest of 60.86
- Selling pressure intraday will strengthen with a failed retest of 59.7
- Resistance sits near 60.47 to 60.84, with 61.36 and 62.02 above that.
- Support holds near 60.02 to 59.7, with 59.2 and 58.4 below that.
If you’re interested in the live trading room, it is now primarily stock market futures content, though we do track heavily traded stocks and their likely daily trajectories as well – we begin at 9am with a morning report and likely chart movements along with trade setups for the day.
As long as the trader keeps himself aware of support and resistance levels, risk can be very adequately managed to play in either direction as bottom picking remains a behavior pattern that is developing with value buyers and speculative traders.
Twitter: @AnneMarieTrades
The author trades stock market futures every day and may have a position in mentioned securities at the time of publication. Any opinions expressed herein are solely those of the author, and do not in any way represent the views or opinions of any other person or entity.
: Creating Bullish Divergence?")


: Creating Bullish Divergence?")