The following chart and data highlight non-commercial commodity futures trading positions as of February 13, 2017.
This data was released with the February 16 COT Report (Commitment of Traders). Note that these charts also appeared on my blog.
The chart below looks at non-commercial futures trading positions for the Gold Futures. For the week, Gold traded higher by +3.0%.
GOLD
February 16 COT Report Spec positioning: Currently net long 175.6k, down 15.3k.
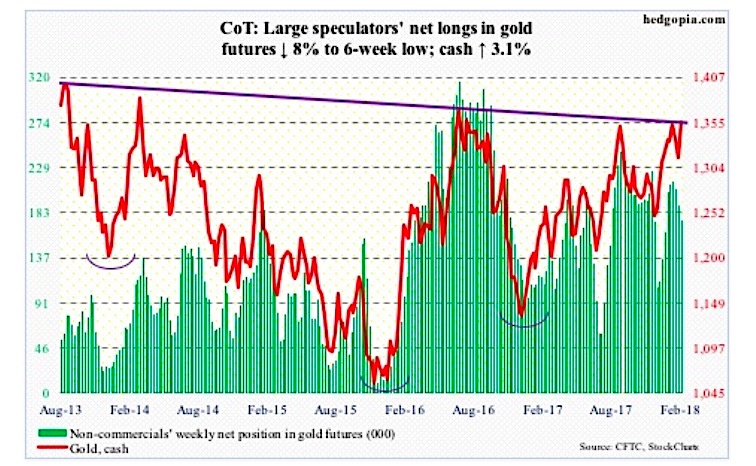
Last week, Gold nearly tested crucial support at $1,300, dropping to $1,309 on February 8. This was preceded by a drop after peaking at $1,365.40 on January 25. This was an important level.
Back then, Gold was rejected at a slightly falling trend line from August 2013. On Friday, it literally closed on it. This level also approximates the neckline of a reverse-head-and-shoulders formation. Then there is Fibonacci resistance. Gold peaked in September 2011 at $1,923.70, then bottoming at $1,045.40 in December 2015. A 38.2-percent retracement of this decline lies at $1,380.91.
This week’s rally was helped by a lower dollar, as likely did the higher-than-expected CPI print. Flows, however, were a negative.
In the week through Wednesday, IAU (iShares gold trust) saw no activity, while GLD (SPDR gold ETF) lost $136 million (courtesy of ETF.com).
That said, it is not too surprising for gold – or any other asset, for that matter – to hesitate and witness a back-and-forth around the kind of resistance it finds itself facing currently.
The benefit of the doubt remains with the bulls, unless $1,300 is lost.
Twitter: @hedgopia
Author may hold a position in mentioned securities at the time of publication. Any opinions expressed herein are solely those of the author, and do not in any way represent the views or opinions of any other person or entity.


