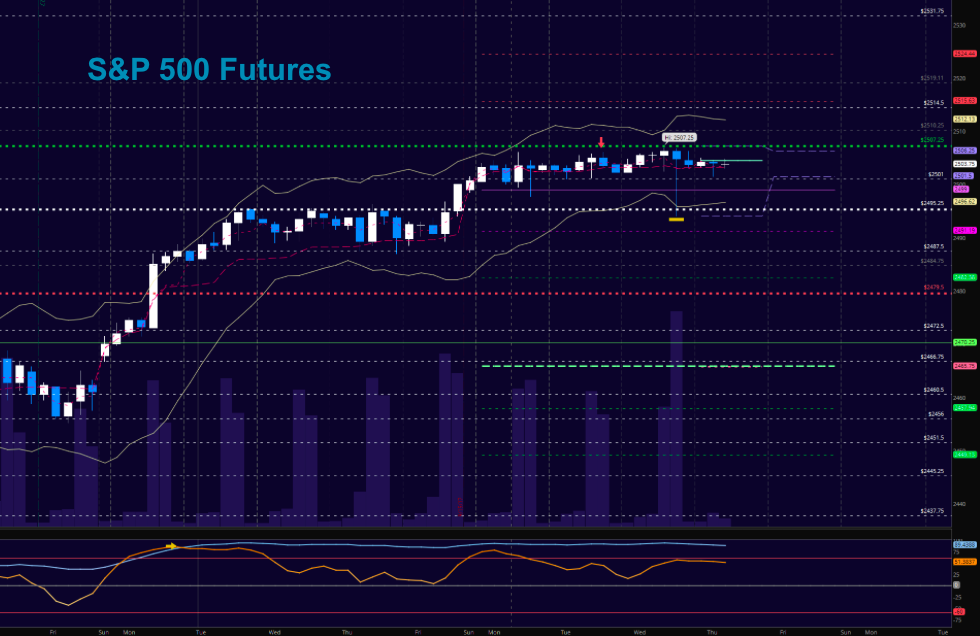
S&P 500 Chart Spotlight: 2500 and Big Round Numbers
The S&P 500 (INDEXSP:.INX) is still technically in rally mode as the short-term and intermediate-term trends are in tact. However, stocks are sure magnetized...
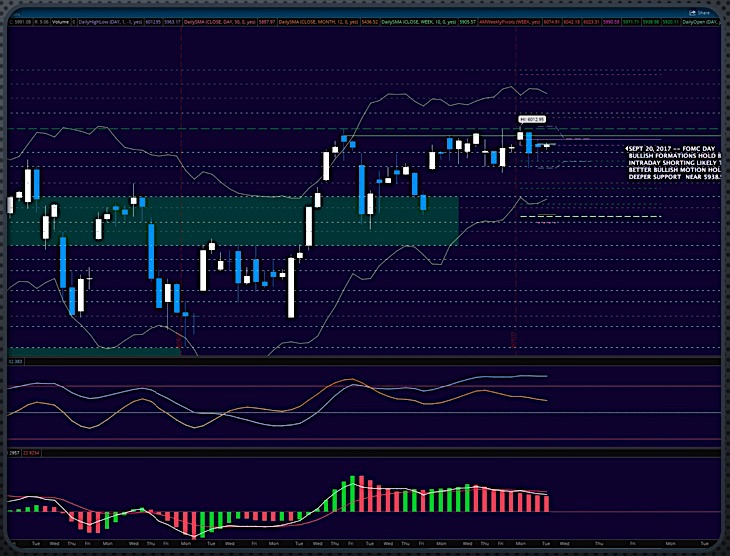
Nasdaq 100 (NDX) Trading Update: Topping Formation?
As mentioned in the title, the chart of the Nasdaq 100 Index (INDEXNASDAQ:.IXIC) is showing topping formations.
The chart below shows overhead resistance... and how...
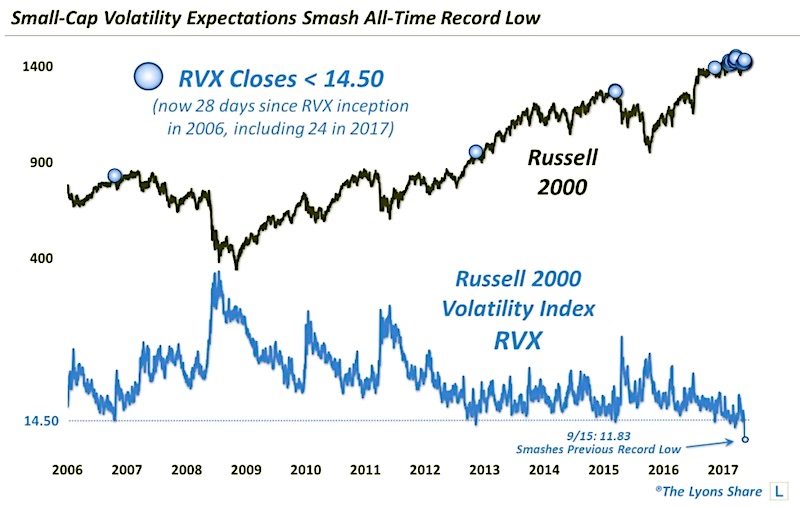
Russell 2000 Volatility Index Hits Record Lows: Trouble Ahead?
Small-Cap volatility expectations just smashed previous record lows.
I’ve written a fair amount lately on various themes related to volatility expectations in the stock market.
Many...
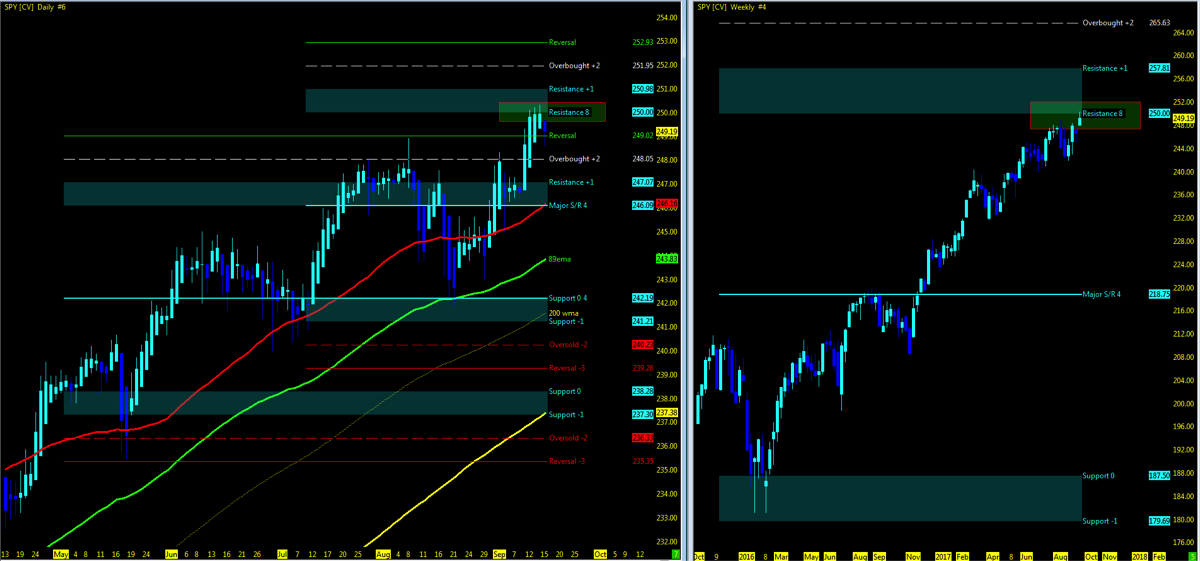
Stock Market Trends Weekly Update: Bulls Running
THE BIG PICTURE
The broader stock market remains in an uptrend. Worries continue to linger, but the best thing to do is follow the price...
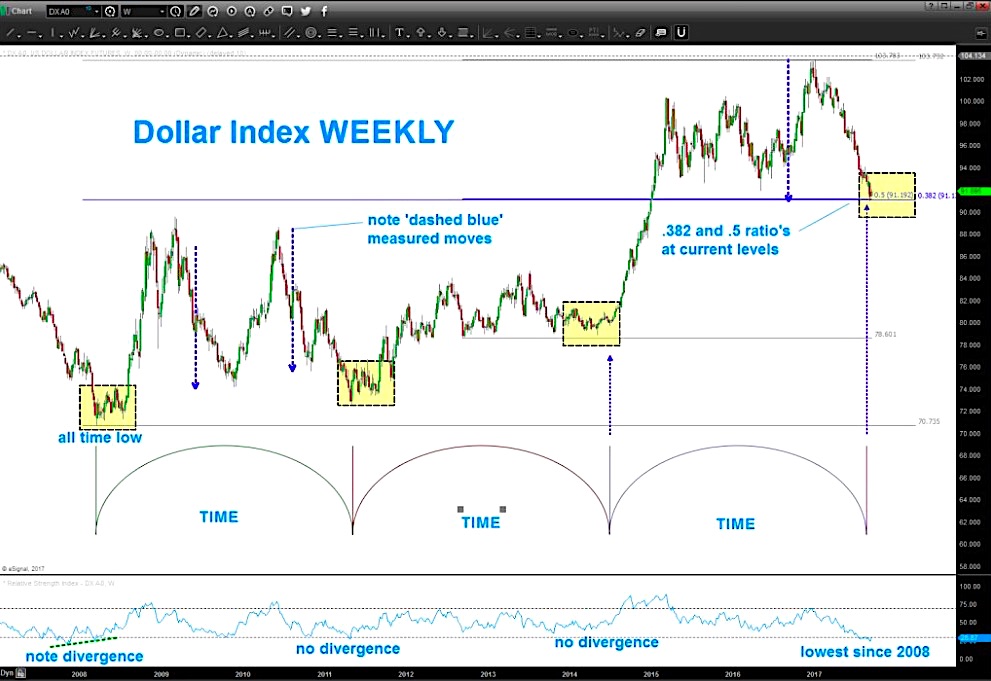
U.S. Dollar Index Most Oversold Since 2008
Lots of indecision around the Dollar right now. I'm honestly in the "I don't know" camp when it comes to the current major trend...
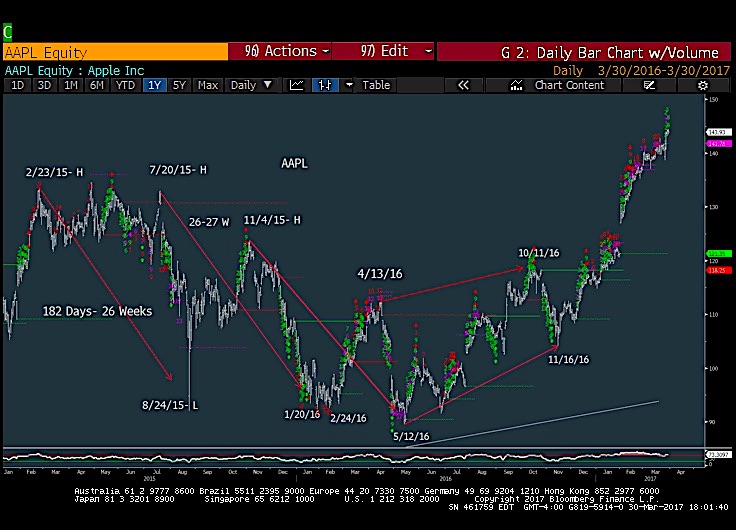
Apple (AAPL) Stock Chart Update: Cycles, Fibonacci, Gann
Yesterday, I shared my thoughts on where Apple's stock (NASDAQ:AAPL) was headed next. I used daily, weekly, and monthly charts to provide context and...
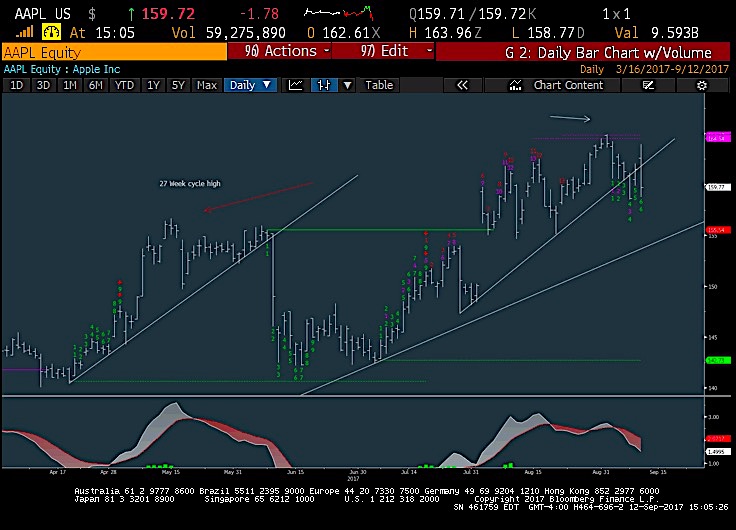
Why Apple’s Stock (AAPL) Is Headed For A Correction
Given today's iPhone X launch, I thought it was a great opportunity to discuss where Apple's stock (NASDAQ:AAPL) is right now... and where it...
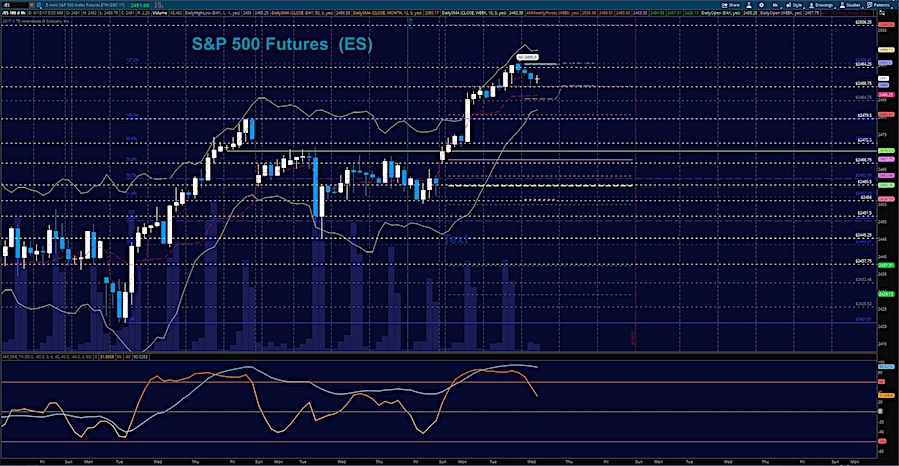
S&P 500 Futures Trading Update: Time For A Breather?
Stock Market Considerations for September 13, 2017
The S&P 500 (INDEXSP:.INX) is mixed in early trading action. After a multi-day rally, traders will want to...
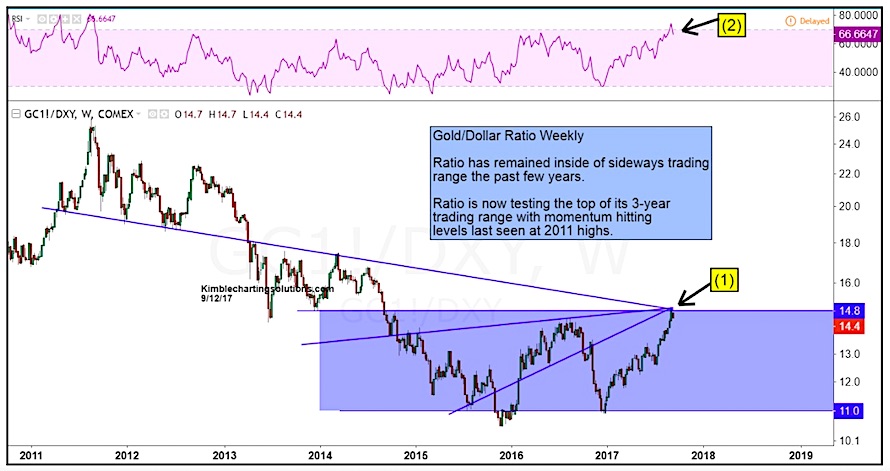
Gold / U.S. Dollar Ratio Racing To A Near-Term Peak?
Two of 2017's major investing themes thus far are the return of Gold (NYSEARCA:GLD) and the prolonged weakness in the U.S. Dollar (CURRENCY:USD).
Year-to-date, Gold...
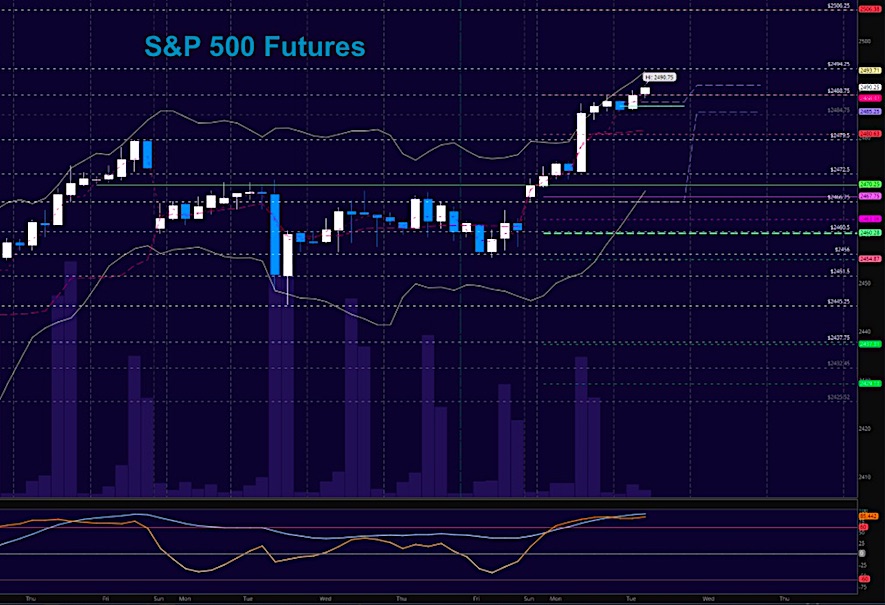
S&P 500 Futures Trading Update For September 12
Stock market futures trading considerations for September 12, 2017
The S&P 500 (INDEXSP:.INX) is pointing higher once more on Tuesday. Traders will want to follow...

