Given today’s iPhone X launch, I thought it was a great opportunity to discuss where Apple’s stock (NASDAQ:AAPL) is right now… and where it may be headed.
The following 3 charts look at Apple’s stock price on daily, weekly, and monthly time frames from a technical perspective.
Apple (AAPL): Is There Trouble On The Horizon?
And the results aren’t all that bullish. In fact, they’re skewed bearish looking out over the next 6-8 weeks. Question now is whether the iPhone X launch be seen as a prelude to an Apple stock correction (i.e. a “sell the news” event).
IF Apple (AAPL) could regain prior highs, and help momentum begin to improve, this could change.
However, the combination of technicals on a daily, weekly and monthly basis initially suggest that the stock is at risk of topping near-term and a correction may be on the horizon.
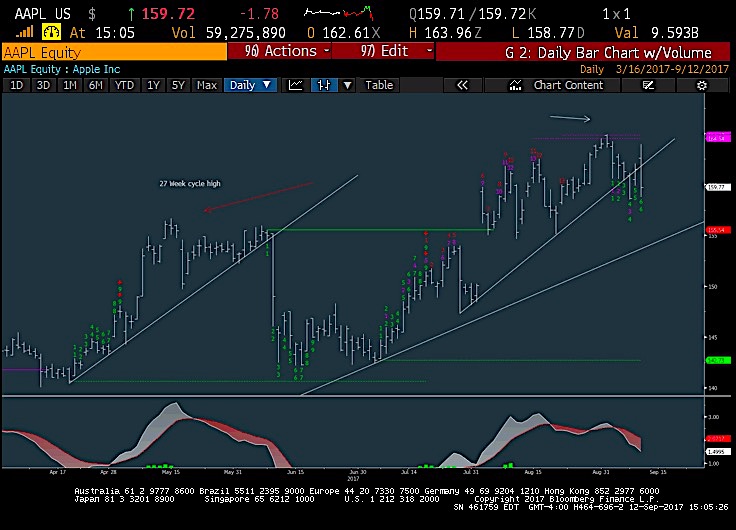
Apple (AAPL) Daily Bar Chart
Apple’s stock price is reversing sharply off earlier highs, and momentum had been waning of late anyway , but under 158.50 would suggest a pullback to at least 155 initially
We’ve been seeing more and more signs of momentum gradually waning in this since early August which has caused momentum to turn down pretty sharply.
While the broader structure is still ok, the near-term view calls for selloffs in AAPL between now and late October, so I don’t view AAPL as the best risk/reward technically.
Click here for next AAPL chart…


