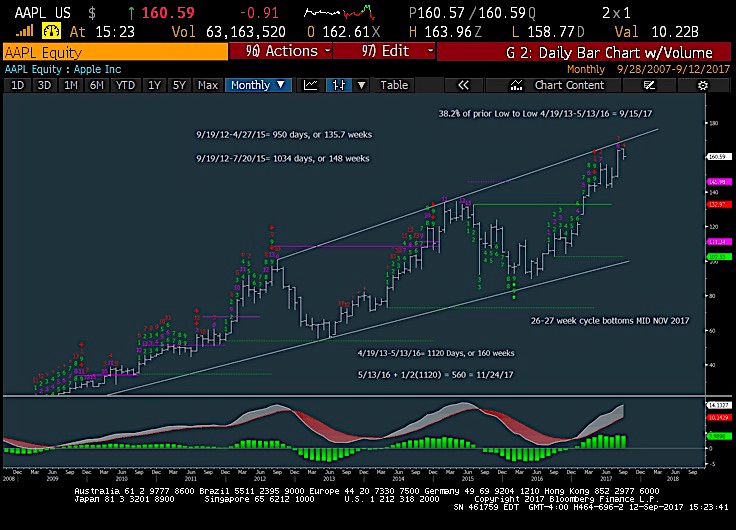
Apple (AAPL) Monthly Bar Chart
This longer-term chart also backs up this area as being important for a top given prior highs… and just by using Fibonacci ratios of former low to low swing, we arrive at 9/15/17.
So time cycles are aligning for a top as well.
Given the 26-27 week cycle (that I’ve shared with subscribers many times in the last 6 months), AAPL last peaked out during this time in mid-May and is due again for a “turn” in mid-November. But this turn aligns with what very well may be a LOW.
If you are an institutional investor and have an interest in seeing timely intra-day market updates on my private twitter feed, please follow @NewtonAdvisors. Also, feel free to send me an email at info@newtonadvisor.com regarding how my Technical work can add alpha to your portfolio management process.
Twitter: @MarkNewtonCMT
Author has positions in mentioned securities at the time of publication. Any opinions expressed herein are solely those of the author, and do not in any way represent the views or opinions of any other person or entity.


 and Semiconductors (SMH): Concerning Price Pattern?")


