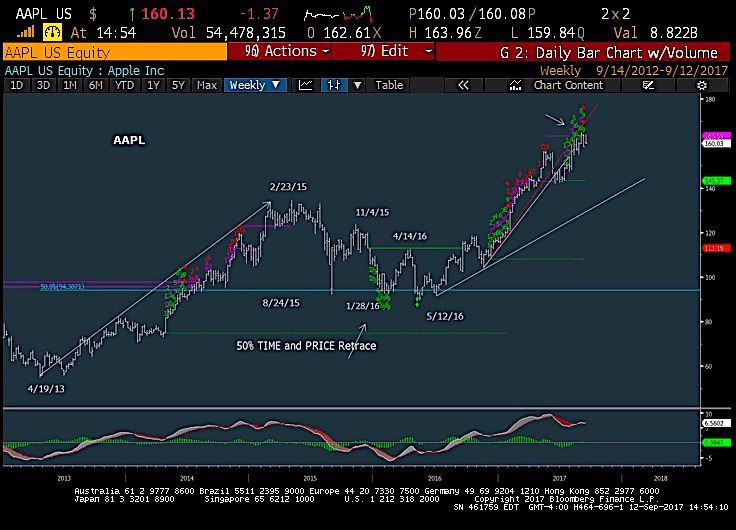
Apple (AAPL) Weekly Bar Chart
Apple’s stock price on a “weekly” basis is now showing a completed 9-13-9 pattern on Demark analysis. The 26-27 week cycles suggest weakness from here into mid-November.
Any WEEKLY CLOSE now at this point UNDER the close from four weeks ago would be a weekly sign to hold off on buying dips right away into October.
Likely best to let at least a minor selloff take its course.
50 percent price and time corrections, along with several 26-27 week high to high and low to low turns… roughly 180 calendar days.
Click here for next AAPL chart…


")


