THE BIG PICTURE
The broader stock market remains in an uptrend. Worries continue to linger, but the best thing to do is follow the price action and avoid anticipation due to “noise”. If/When we enter a market correction, your process should stop you out of the trade.
Without further adieu, here’s my weekly futures trading update and outlook. We’ll start with the S&P 500 (INDEXSP:.INX).
S&P 500 Futures (ES) – Week 38 (week of September 18)
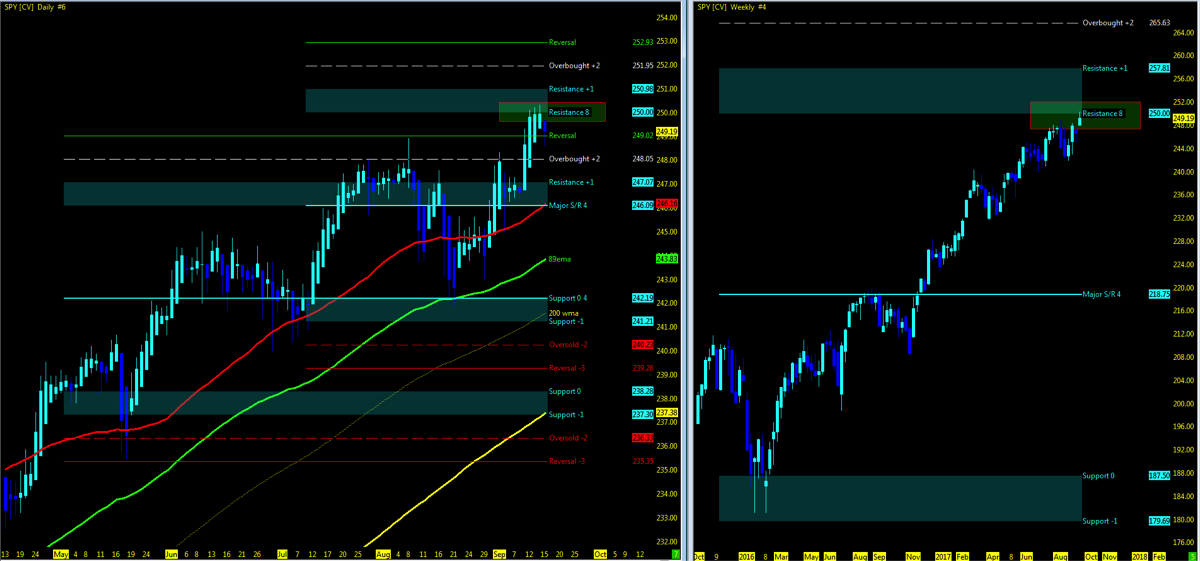
A Note On Using MML Charts: Using the Murray Math Level (MML) charts on higher time frames can be a useful market internal tool as price action moves among fractal levels from hourly to weekly charts. Confluence of levels may be levels of support/resistance or opportunities for a breakout move. Optimal setups will pass through Resistance or Support prior to moving in the opposite trend.
Technical Trends…
- Check out my week 37 recap and trend charts.
- Stock market momentum remains upside.
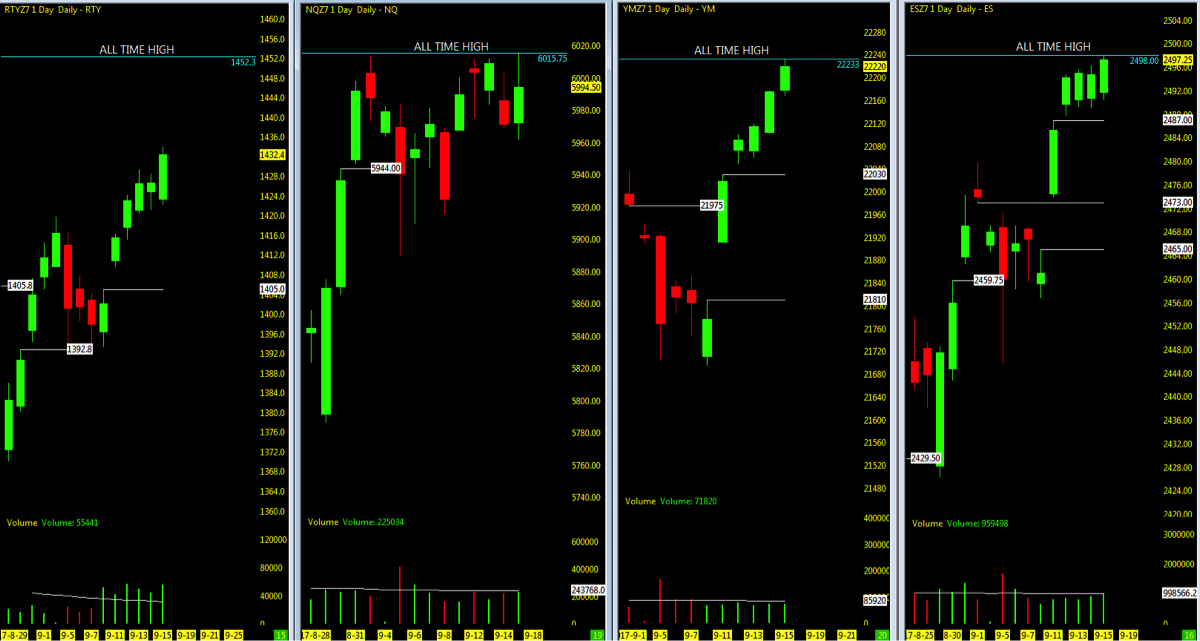
- The Dow Jones (YM), Nasdaq 100 (NQ), and S&P 500 futures (ES) are all time highs with the Russell 2000 (INDEXRUSSELL:RUT) lagging.
- The VIX Volatility Index (INDEXCBOE:VIX) is back near the low 10’s.
- FANG/FAMMG stocks just off their 52 week high with Google off the most
- All 4 major stock market indices are at MML Zone High with YM breakout to short term upper resistance
- ES/YM/RTY with nearest open gaps downside (see open gaps chart below)
- Stock market indices major key moving averages in sync with 10>50>200
- RTY exception 50<200
- RTY volume pickup on contract transfer from TF (ICE exchange)
- NQ/YM/ES volume even with 60 period average
- Crude Oil regains traction to MML highs
- 50ma remains under 200 with price action above all three (10, 50, 200)
- Gold pulled back off MML high
- MML short setup at 1343.8 with momentum now downside. 50ma>200.
- Current IBD Outlook: Confirmed Uptrend (FFTY)
Key Events in the Market This Week
- FOMC, Religious Holiday
- Adobe reports
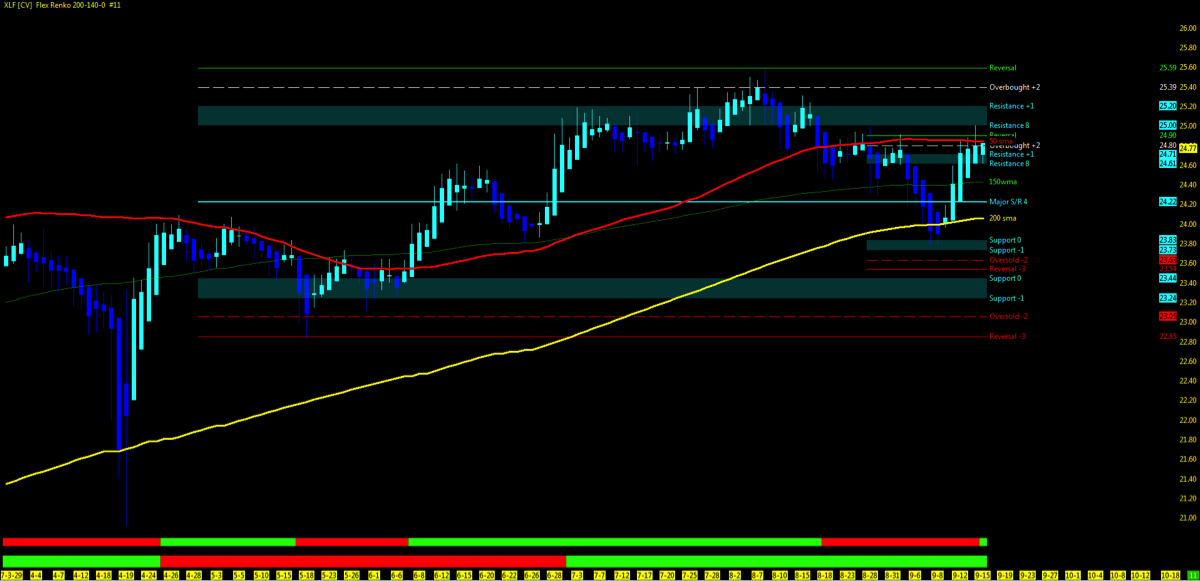
- 5 Bank Giants are trading in consolidation and this is evident on the Financial Sector ETF (XLF) chart below
THE BOTTOM LINE
Technical Momentum probability on the indices remains in an UPTREND. Watch for MML setups on price action break above resistance high and back under resistance low. Watch for open gaps to be closed and 50% pullback.
Check out my latest Video and market outlook for the week ahead. I cover ES, YM, NQ, GC, CL and several ETF’s
THE LOWEST OPEN GAPS
- ES: 1589
- NQ: 3864.75
- YM: 14745
Attempting to determine which way a market will go on any given day is merely a guess in which some will get it right and some will get it wrong. Being prepared in either direction intraday for the strongest probable trend is by plotting your longer term charts and utilizing an indicator of choice on the lower time frame to identify the setup and remaining in the trade that much longer. Any chart posted here is merely a snapshot of current technical momentum and not indicative of where price may lead forward.
Thanks for reading and remember to always use a stop at/around key technical trend levels.
Twitter: @TradingFibz
The author trades futures intraday and may have a position in the mentioned securities at the time of publication. Any opinions expressed herein are solely those of the author, and do not in any way represent the views or opinions of any other person or entity.

 Testing Important Price Support")
: Cup (and Maybe Handle) Watch")

