Stock market futures trading considerations for September 12, 2017
The S&P 500 (INDEXSP:.INX) is pointing higher once more on Tuesday. Traders will want to follow the support/resistance levels (and retest levels!) listed below for the S&P 500, Nasdaq, and crude oil.
Check out today’s economic calendar with a full rundown of releases. And note that the charts below are from our premium service and shared exclusively with See It Market readers.
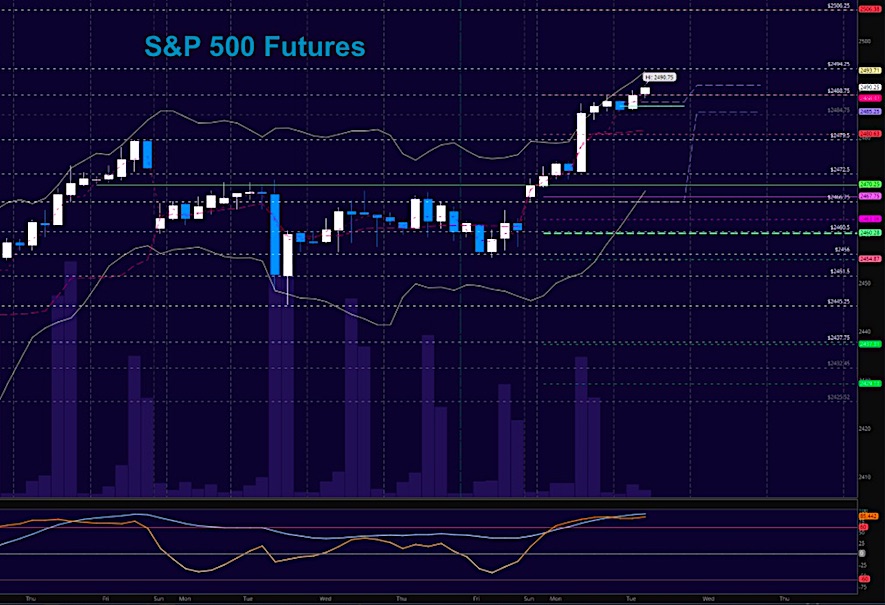
S&P 500 Futures (ES)
Bounce action holds into breakout areas after the mild fade and we are set to open at new highs under buliish momentum. The bullets below represent the likely shift of trading momentum at the positive or failed retests at the levels noted.
- Buying pressure intraday will likely strengthen above a positive retest of 2488.25 ( a pullback off these current highs)
- Selling pressure intraday will likely strengthen with a failed retest of 2479 (to fill the gap)
- Resistance sits near 2485 to 2488.75, with 2493.5 and 2498.75 above that.
- Support holds between 2484.75.5 and 2479.75, with 2473.5 and 2467.5 below that.
NASDAQ Futures (NQ)
Momentum is turn positive on the Nasdaq (INDEXNASDAQ:.IXIC) chart, as it races to prior highs. Breakout formations hold above 5987. The bullets below represent the likely shift of intraday trading momentum at the positive or failed tests at the levels noted.
- Buying pressure intraday will likely strengthen with a positive retest of 5994 (fade off the rise)
- Selling pressure intraday will likely strengthen with a failed retest of 5971
- Resistance sits near 5994.5 to 6006, with 6019.75, and 5997.5 above that.
- Support holds between 5971.25 and 5956.5, with 5935 and 5817.5 below that.

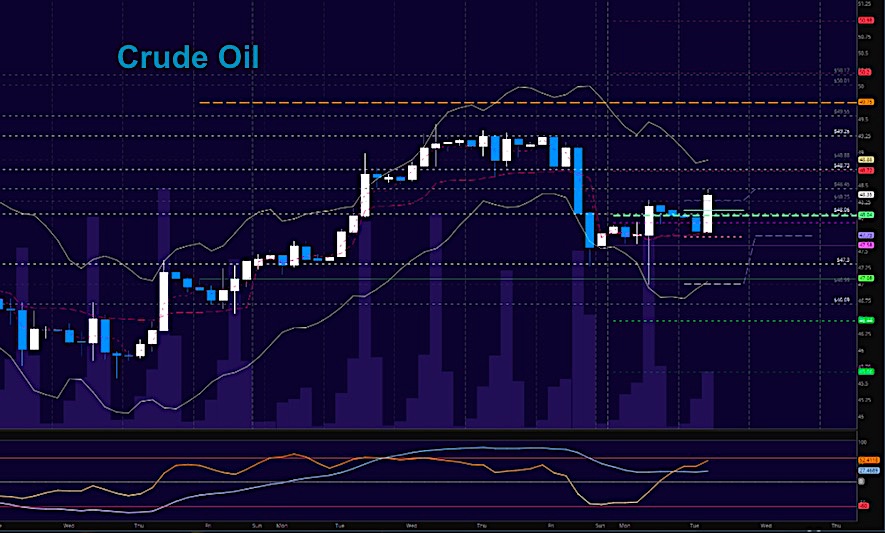
WTI Crude Oil
Hedge funds have shifted long once again so watch for support levels to attempt bounces. Resistance sits at 48.87 and 49.23. API report after the close is likely to create some kind of catalyst. Buyers will have the upper hand as long as we hold 47.4. Big formations are still mixed. The bullets below represent the likely shift of trading momentum at the positive or failed tests at the levels noted.
- Buying pressure intraday will likely strengthen with a positive retest of 48.45
- Selling pressure intraday will strengthen with a failed retest of 47.54
- Resistance sits near 48.87 to 49.25, with 49.71 and 49.97 above that.
- Support holds between 47.54 to 47.04, with 46.64 and 46.2 below that.
If you’re interested in watching these trades go live, join us in the live trading room from 9am to 11:30am each trading day. Visit TheTradingBook for more information.
If you’re interested in the live trading room, it is now primarily stock market futures content, though we do track heavily traded stocks and their likely daily trajectories as well – we begin at 9am with a morning report and likely chart movements along with trade setups for the day.
As long as the trader keeps himself aware of support and resistance levels, risk can be very adequately managed to play in either direction as bottom picking remains a behavior pattern that is developing with value buyers and speculative traders.
Twitter: @AnneMarieTrades
The author trades stock market futures every day and may have a position in mentioned securities at the time of publication. Any opinions expressed herein are solely those of the author, and do not in any way represent the views or opinions of any other person or entity.


