Stock Market Considerations for September 13, 2017
The S&P 500 (INDEXSP:.INX) is mixed in early trading action. After a multi-day rally, traders will want to be focused resistance levels and how price reacts around those levels. Below are key futures trading levels for the S&P 500, Nasdaq, and crude oil.
Check out today’s economic calendar with a full rundown of releases. And note that the charts below are from our premium service and shared exclusively with See It Market readers.
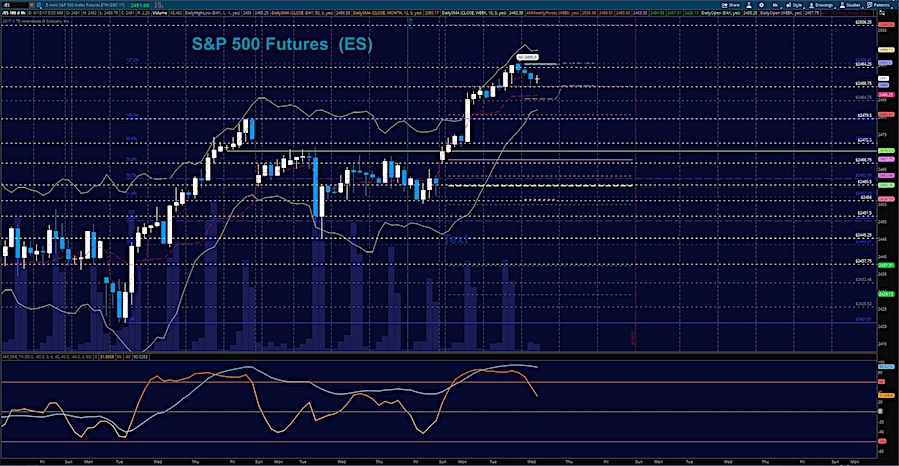
S&P 500 Futures (ES)
Chart fades off a 1.272 Fibonacci extension into support near 2488.75 Momentum is still bullish but support tests are likely. The bullets below represent the likely shift of trading momentum at the positive or failed retests at the levels noted.
- Buying pressure intraday will likely strengthen above a positive retest of 2489 ( a pullback off these current highs)
- Selling pressure intraday will likely strengthen with a failed retest of 2483
- Resistance sits near 2489 to 2492.75, with 2495.5 and 2499.75 above that
- Support holds between 2484.5 and 2479.75, with 2473.5 and 2467.5 below that
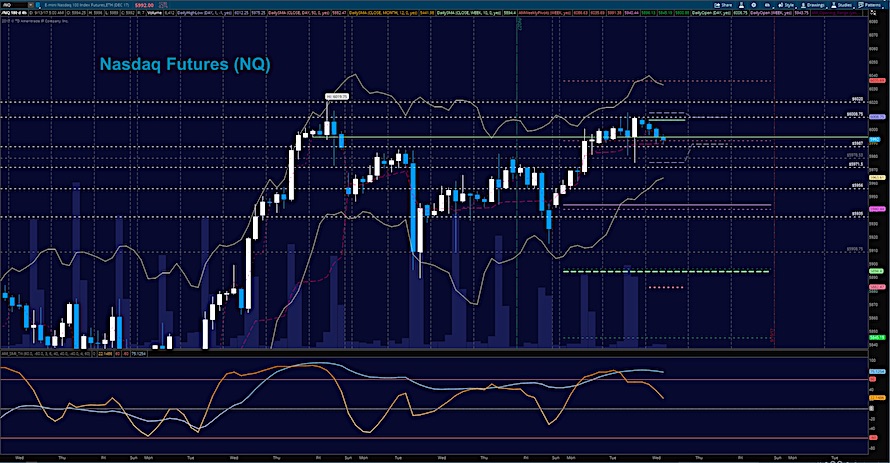
NASDAQ Futures (NQ)
I’m seeing a short-term topping formation on the Nasdaq (INDEXNASDAQ:.IXIC). Continuation of the breakout formation holds above 6001.25. The bullets below represent the likely shift of intraday trading momentum at the positive or failed tests at the levels noted.
- Buying pressure intraday will likely strengthen with a positive retest of 5994 (fade off the rise)
- Selling pressure intraday will likely strengthen with a failed retest of 5978.5
- Resistance sits near 6001.5 to 6006.75, with 6012.75, and 6020.5 above that
- Support holds between 5987.25 and 5971.5, with 5963.75 and 5946.5 below that
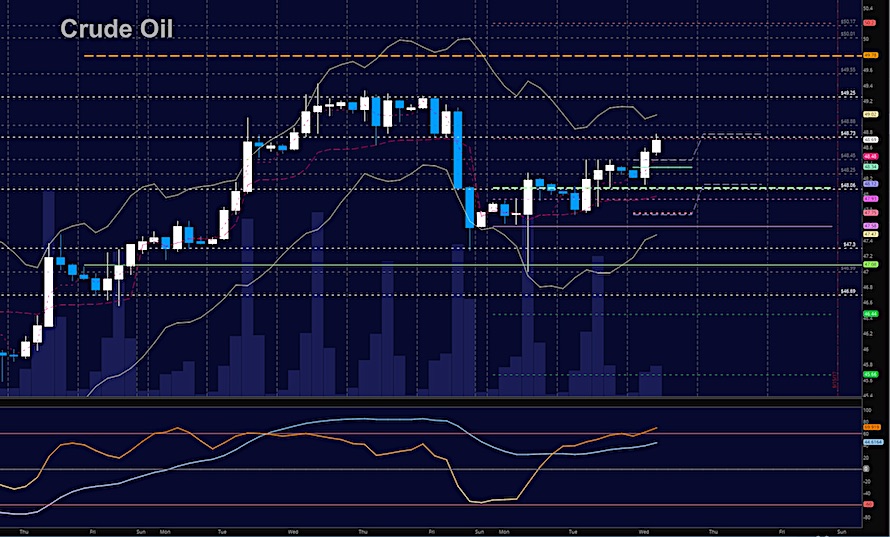
WTI Crude Oil
Hedge funds have shifted long have held support levels well. First resistance still sits at 48.87 and 49.23. EIA report at 10:30 ET. Buyers will have the upper hand as long as we hold 48.12. Big formations are still mixed but showing more promise of upside. The bullets below represent the likely shift of trading momentum at the positive or failed tests at the levels noted.
- Buying pressure intraday will likely strengthen with a positive retest of 49.25
- Selling pressure intraday will strengthen with a failed retest of 47.94
- Resistance sits near 48.78 to 49.16, with 49.71 and 49.97 above that
- Support holds between 48.34 to 48.12, with 47.75 and 47.49 below that
If you’re interested in watching these trades go live, join us in the live trading room from 9am to 11:30am each trading day. Visit TheTradingBook for more information.
If you’re interested in the live trading room, it is now primarily stock market futures content, though we do track heavily traded stocks and their likely daily trajectories as well – we begin at 9am with a morning report and likely chart movements along with trade setups for the day.
As long as the trader keeps himself aware of support and resistance levels, risk can be very adequately managed to play in either direction as bottom picking remains a behavior pattern that is developing with value buyers and speculative traders.
Twitter: @AnneMarieTrades
The author trades stock market futures every day and may have a position in mentioned securities at the time of publication. Any opinions expressed herein are solely those of the author, and do not in any way represent the views or opinions of any other person or entity.


