The S&P 500 (INDEXSP:.INX) is still technically in rally mode as the short-term and intermediate-term trends are in tact. However, stocks are sure magnetized to the 2500 level on the S&P 500 and 6000 level on the Nasdaq 100 (INDEXNASDAQ:NDX).
For traders, patience some is required.
We are all different in our approach and time frames matter. Day traders should watch key near-term levels for setups and risk management, while swing traders should monitor similar levels but expand to an appropriate time frame.
Pullbacks are still likely to be bought, but traders should be watchful of a change in behavior (i.e. a pullback that loses near-term support).
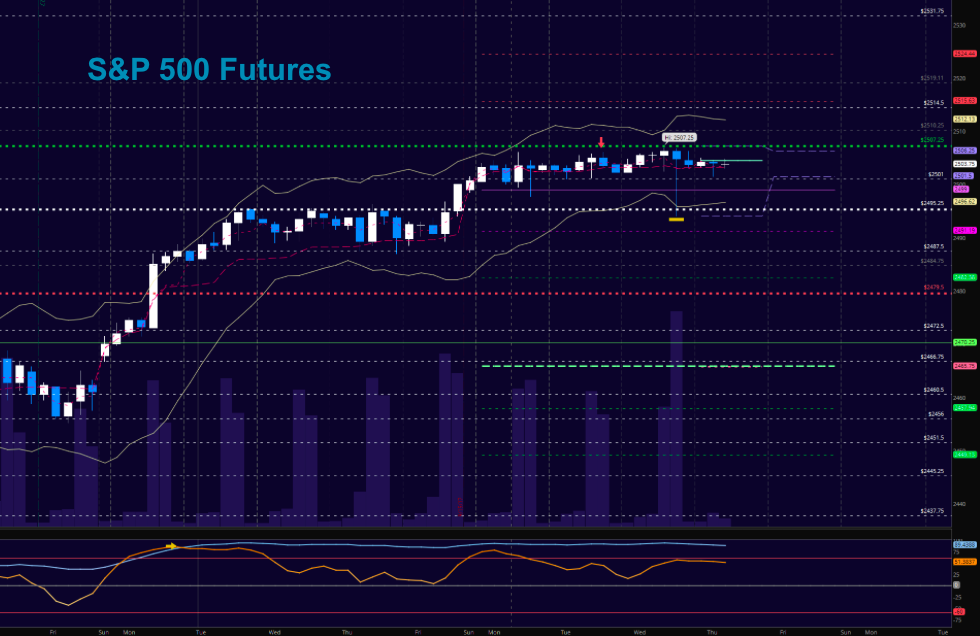
S&P 500 futures (ES) have been battling near-term resistance (2506-07). A move above this level should see an extension, however momentum and volume would need to follow or it would be sold. Support remains at 2495, and deeper at 2479.
S&P 500 Futures Chart
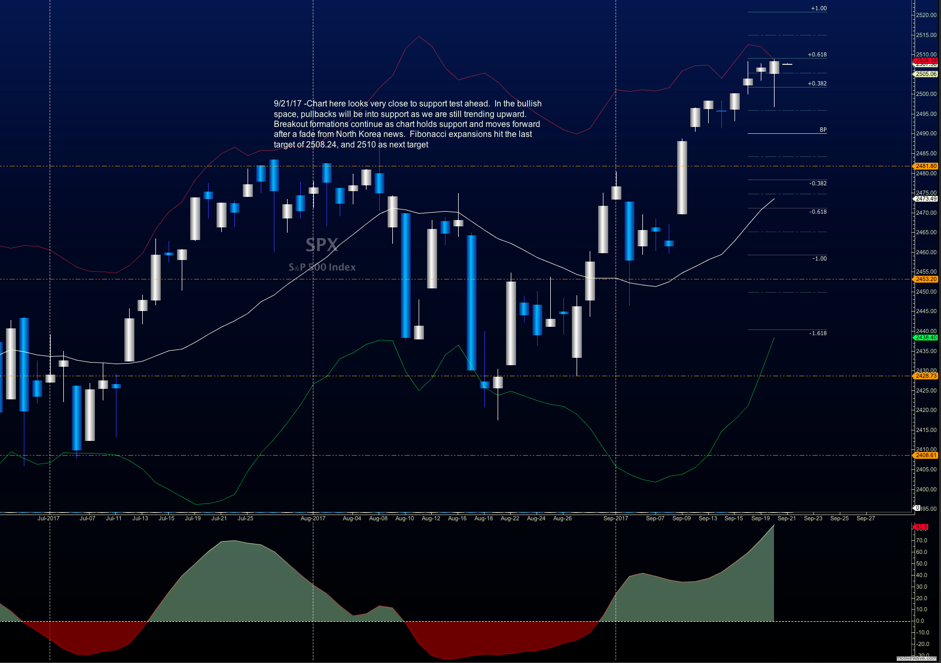
S&P 500 Index Chart
As long as the trader keeps himself aware of support and resistance levels, risk can be very adequately managed to play in either direction as bottom picking remains a behavior pattern that is developing with value buyers and speculative traders. Thanks for reading.
Twitter: @AnneMarieTrades
The author trades stock market futures every day and may have a position in mentioned securities at the time of publication. Any opinions expressed herein are solely those of the author, and do not in any way represent the views or opinions of any other person or entity.


