Two of 2017’s major investing themes thus far are the return of Gold (NYSEARCA:GLD) and the prolonged weakness in the U.S. Dollar (CURRENCY:USD).
Year-to-date, Gold is up 15.72% while the U.S. Dollar is down 9.57%. This follows a multi-year decline in Gold and a multi-year rise in the Dollar.
The question now is whether or not we will see a meaningful trend change in this relationship.
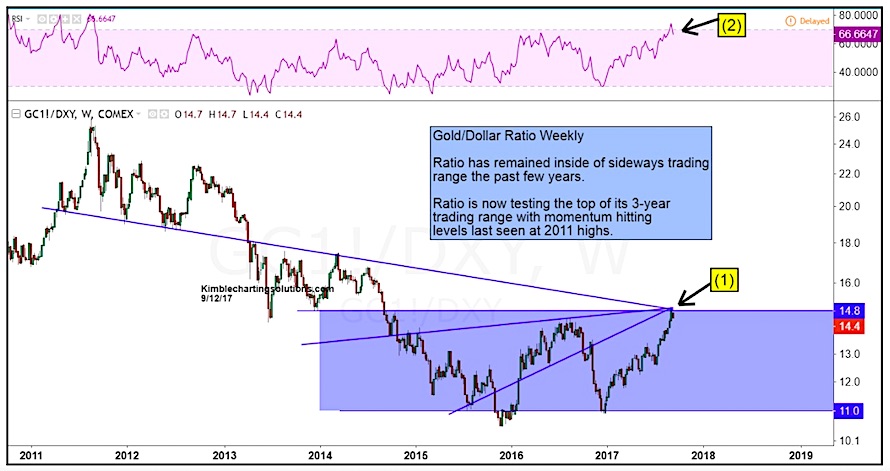
To help answer that question, let’s take a look at the Gold / U.S. Dollar ratio chart. When the trend is rising, gold tends to outperform… and when the trend is in a decline, gold is typically under pressure.
In the chart below, the trend is clearly rising (which has been a positive for Gold). However, you’ll also notice to factors that appear to be headwinds for gold going forward: (1) The rising trend is at a confluence of price resistance points. As well, it is testing the top of its 3-year trading range. (2) At the same time that the Gold/Dollar ratio is hitting price resistance, it is also seeing momentum hit levels last seen near the 2011 highs.
The takeaway: A “lasting” breakout above this level may require a momentum reset (i.e. a breather for gold first). And with other charts showing the U.S. Dollar oversold, this may be in the cards. Gold investors & traders will no doubt want to want to keep an eye on this ratio.
Gold / U.S. Dollar Ratio “Weekly” Bar Chart
Twitter: @KimbleCharting
Any opinions expressed herein are solely those of the author, and do not in any way represent the views or opinions of any other person or entity.

: Showing Some Signs of Emerging Strength")
