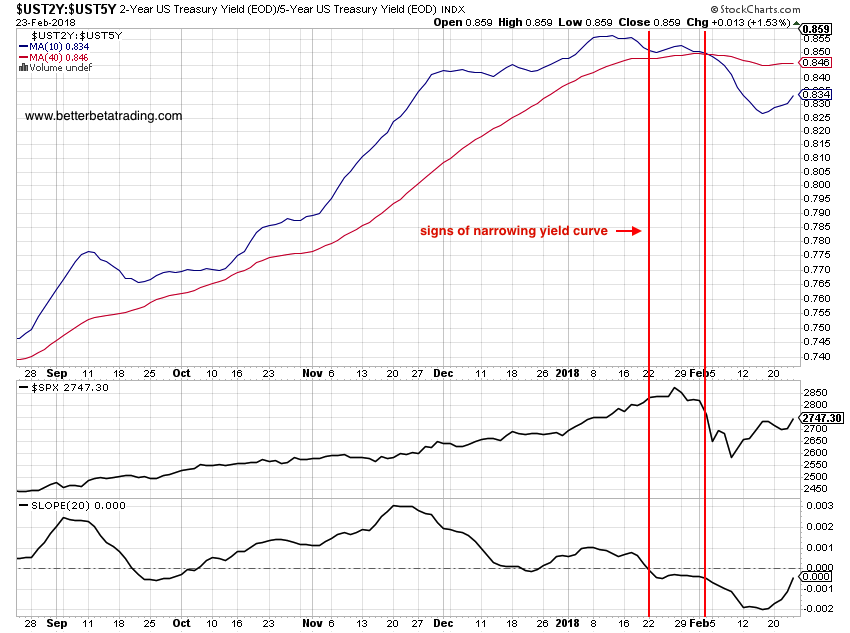
How To Use The Yield Curve As An Equities Risk On/Off Indicator
The drop in equity markets and subsequent V-shaped rebound has left many traders wondering: "Is it safe to increase long equity exposure?"
With pundits on...
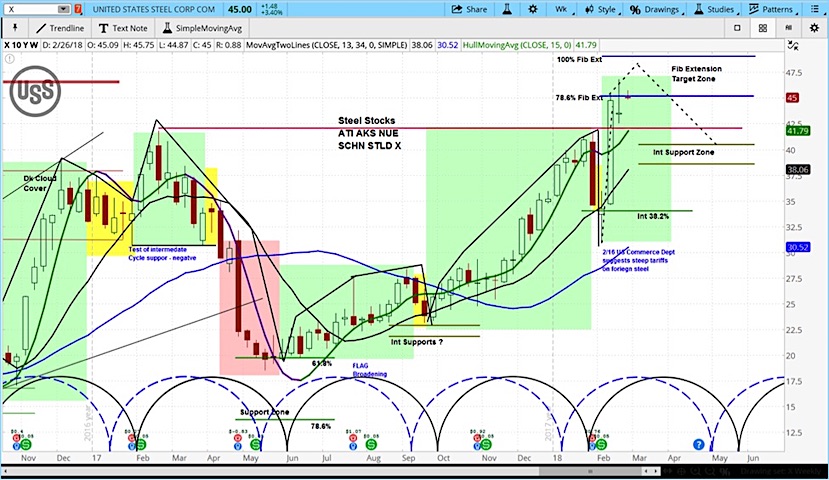
US Steel (X) Rallies On Trump Tariffs, But Stock Faces Near-Term Headwinds
US Steel (X) gapped higher on Monday morning, up around $1.20 to $44.72 which is a 2.5% increase but up as high as 4%...
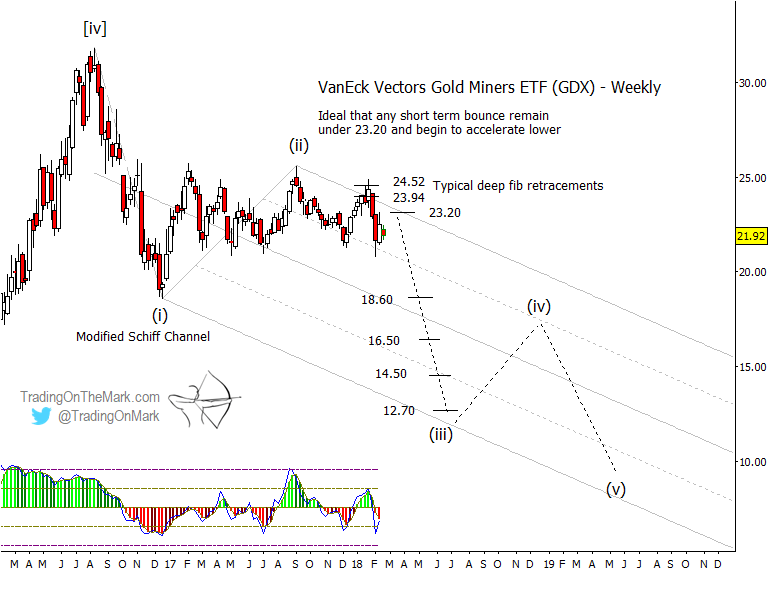
Gold Miners (GDX) Elliott Wave Forecast Points Lower Yet
In December, we highlighted a potential trade developing in the VanEck Vectors Gold Miners ETF (NYSE Arca: GDX). Since that article was posted, we...
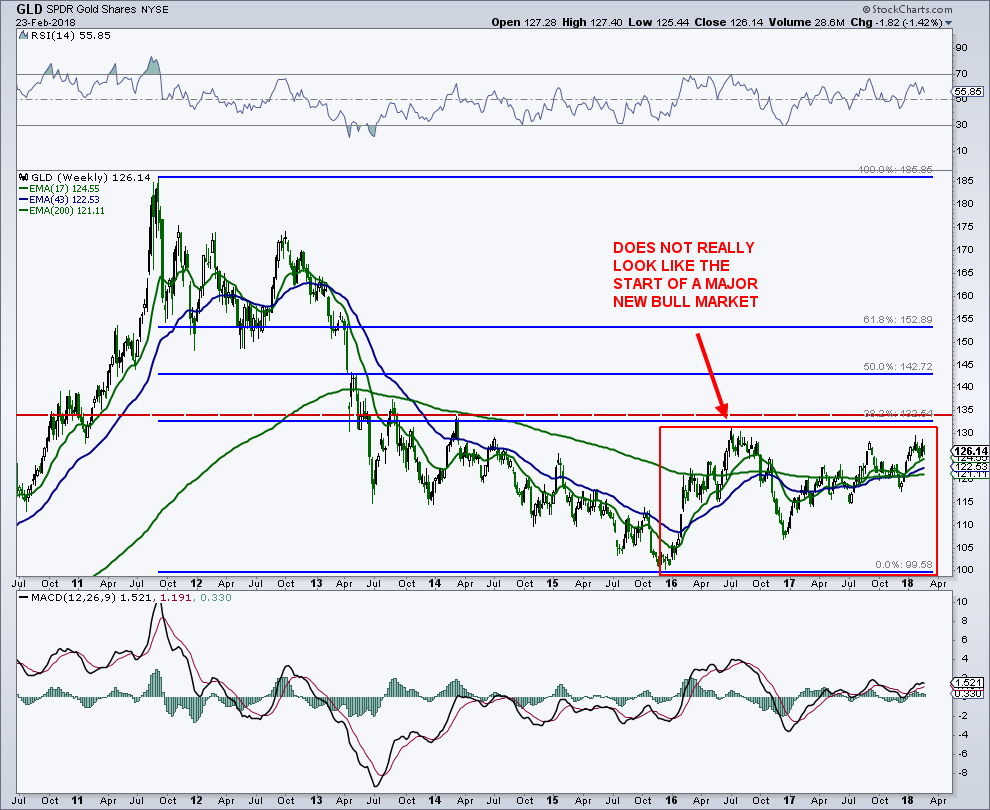
New Gold Bull Market Starting? Not So Fast…
Today, I want to provide a quick update on gold trading and the iShares Gold Trust (GLD). Gold has been meandering beneath major price...
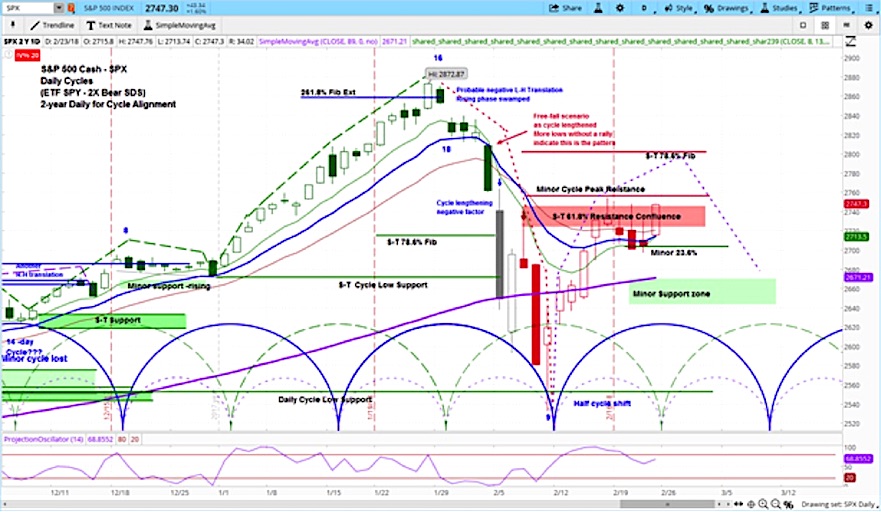
Market Outlook: Stocks Set To Continue Bounce, Then Fail
The S&P 500 reversed course on Friday and rallied back to new 3-week closing highs.
Look for stocks to extend gains into this week before...
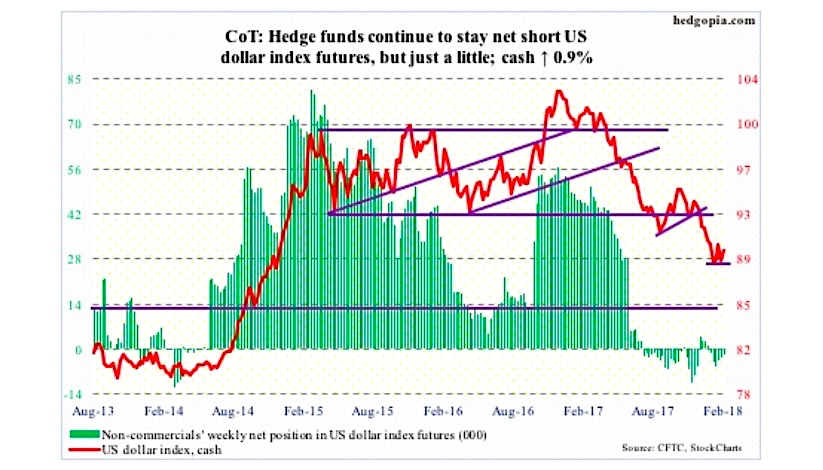
COT Report: Is The US Dollar Carving Out A Bottom?
The following chart and data highlight non-commercial commodity futures trading positions as of February 20, 2017.
This data was released with the February 23 COT...
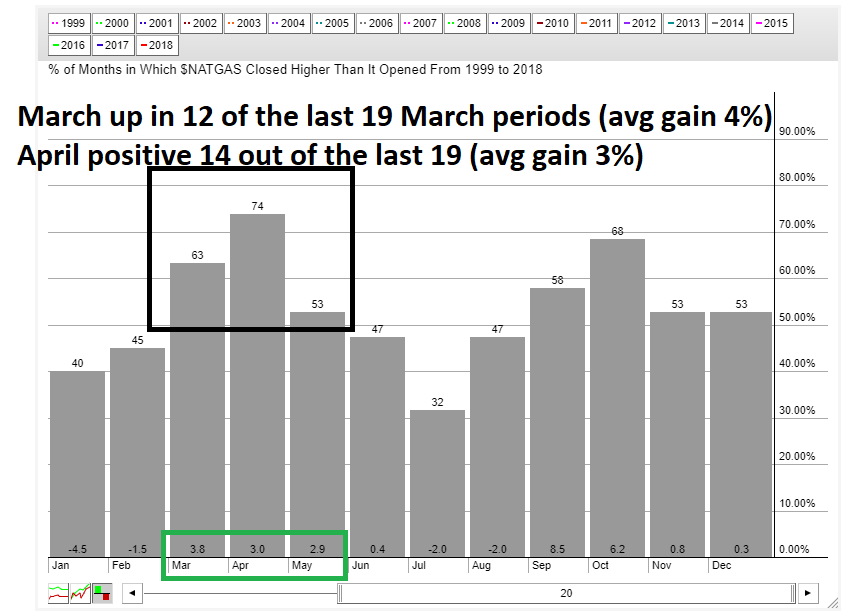
Natural Gas Seasonality Turns Bullish Into Spring Time
Natural gas prices dropped precipitously from Mid January into this week. I covered that in my article earlier this week.
Today I want to look...
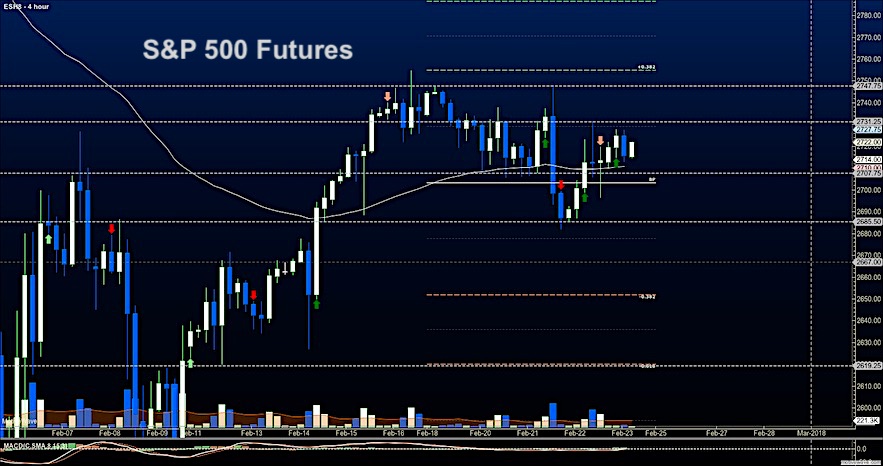
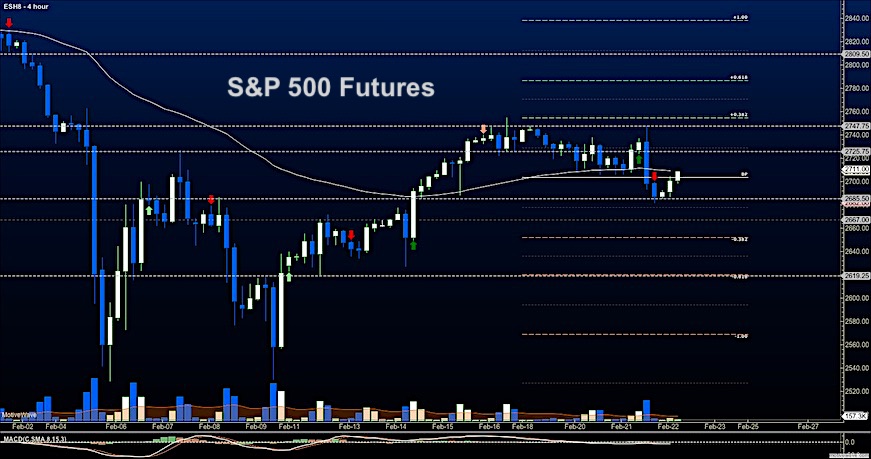
Stock Market Futures Trading Outlook: A Big Break Is Coming
Stock Market Futures Outlook for February 23, 2018
Diminishing directional moves continue as the current price range compresses on the S&P 500. Traders should expect a...
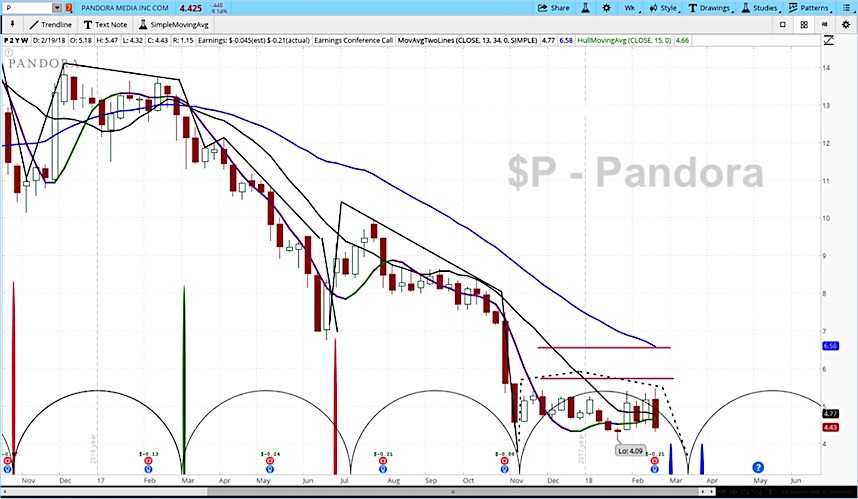
Pandora (P) Earnings Reversal: Stock Pops Then Drops Sharply
Shares of Pandora Internet Radio (P) initially popped 11% to $5.42 yesterday when the company reported an increase in subscription revenue of 63% as...
S&P 500 Futures Update & Trading Outlook: Eyes On 2705
Broad Stock Market Outlook for February 22, 2018
Price resistance stood tall yesterday and rejected the bulls advance. This lead to a very swift move to...

