In December, we highlighted a potential trade developing in the VanEck Vectors Gold Miners ETF (NYSE Arca: GDX). Since that article was posted, we have seen even stronger signals that the market wants to take price substantially downward in coming weeks.
Here we use Elliott wave to offer some price targets in finer detail that a decline could reach this year (and into next year).
Gold Miners Elliott Wave Forecast: Trading Heavy
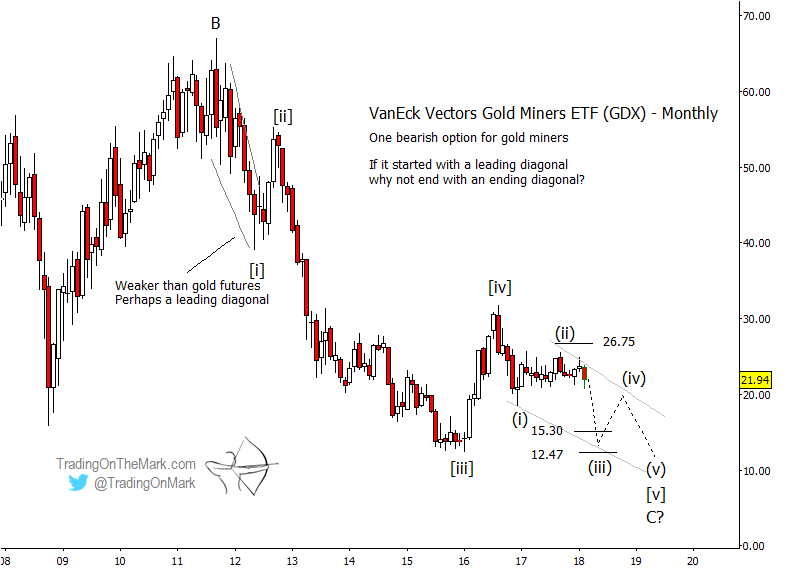
The scale of the expected moves is easiest to see on the monthly chart of the Gold Miners ETF (GDX) – see below. Since we are counting a five-wave decline from the 2011 high, wave [v] should be approximately proportionate to wave [i] in some combination of time and price. However a literally equivalent price measurement downward from the peak of wave [iv] would take price as low as 3.89, which strains credibility.
A more likely development would be for wave [v] to occupy relatively more time than wave [v] did, even though it may traverse a smaller distance in price. An overlapping ending diagonal formation would be one way for wave [v] to do that, although a regular impulsive wave is also possible. In either case, wave [v] should eventually reach beneath the lower low that wave [iii] established.
Inside the expected wave [v], some Fibonacci extension targets for sub-wave (iii) include 15.30 and 12.47. It’s reasonable to expect one or both of those areas to be tested sometime this year.
At this time a modified Schiff channel on the weekly chart below offers the best fit for describing the structure of the developing wave [v]. Anchored on sub-waves (i) and (ii), the channel’s upper boundary and typical Fibonacci retracement levels on a still smaller scale together produced resistance that marked a lower high and sent price back downward to a lower low.
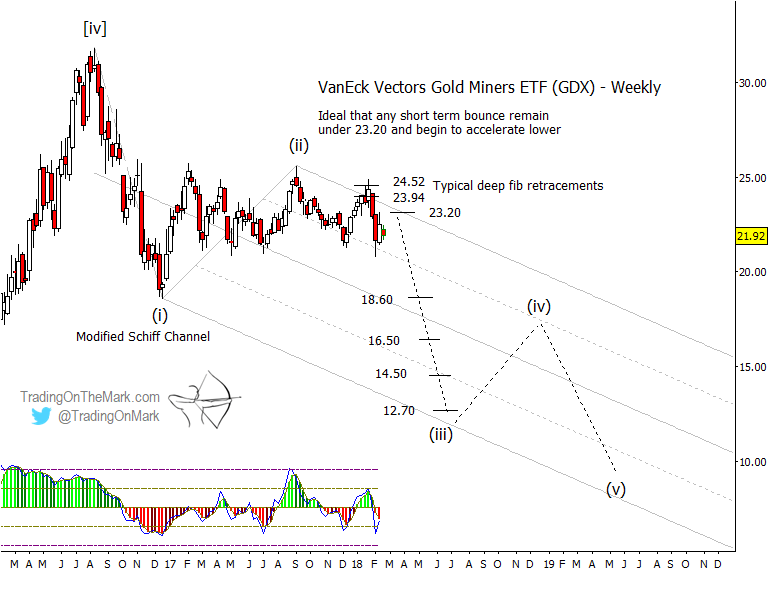
Regardless of whether wave [v] takes a diagonal form, the Gann square-of-nine levels marked on the weekly chart (18.60, 16.50, 14.50, and 12.70) should act as supports and “speed bumps” as price works its way downward. Typically price would approach the lower boundary of the channel in sub-wave (iii), where the lowest of those support levels might come into play.
Eventually, price should attempt an even lower low to complete the Elliott wave pattern, but that probably will not happen in 2018.
This month we’re offering a new kind of subscription incentive. If you’re interested in our Daily Analysis service but you’d also like to get a peek at intraday trading action, then you’ll like this opportunity! Just start a new Daily Analysis subscription during February and we’ll give you access to our intraday trading room for three full weeks as a bonus. It’s a great way to see how we approach the trades on a faster time frame, especially with equity indices.
Twitter: @TradingOnMark
No position in any of the mentioned securities at the time of publication. Any opinions expressed herein are solely those of the author, and do not in any way represent the views or opinions of any other person or entity.


