Stock Market Futures Outlook for February 23, 2018
Diminishing directional moves continue as the current price range compresses on the S&P 500. Traders should expect a strong break soon, but which way seems obscured.
Fades are likely but not without some kind of failed bounce attempts. We sit above important support at 2705, a key price region for buyers to hold.
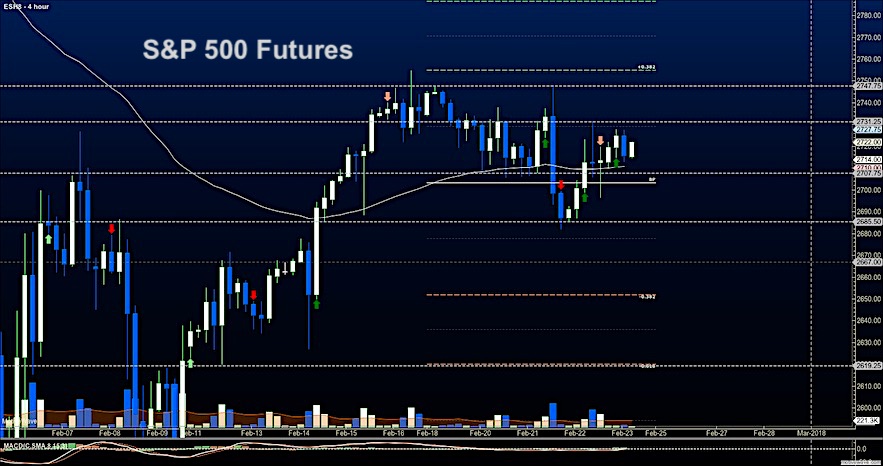
S&P 500 Futures
Price resistance holds near 2729 in a week challenged by crosscurrents. We do look a bit weaker from a bullish perspective. Failure to break and hold above 2736 will bode poorly for recovery and we do see the lower highs showing as sellers advance their lines downward. The weight sits on the traders supporting 2705. Holding their feet there will be key for buyers. The bullets below represent the likely shift of trading momentum at the positive or failed retests at the levels noted.
- Buying pressure intraday will likely strengthen with a positive retest of 2732.5
- Selling pressure intraday will likely strengthen with a failed retest of 2700
- Resistance sits near 2723.75 to 2727.5, with 2732.5 and 2747 above that.
- Support sits between 2704.5 and 2696.25, with 2687.25 and 2672.5 below that.
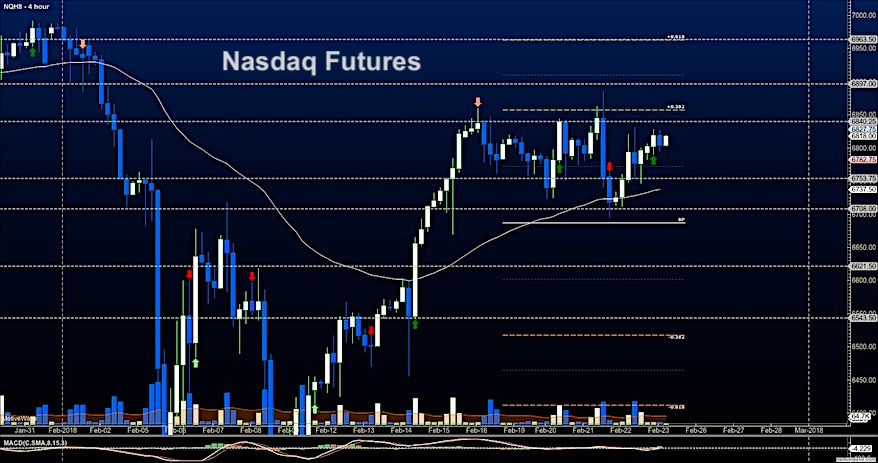
NASDAQ Futures
Momentum remains mixed and damp with price compression here as well. Though support at 6708 holds in general, weakness continues to show through. We are bound between 6708 and 6870. The bullets below represent the likely shift of intraday trading momentum at the positive or failed tests at the levels noted.
- Buying pressure intraday will likely strengthen with a positive retest of 6842.5
- Selling pressure intraday will likely strengthen with a failed retest of 6778
- Resistance sits near 6827 to 6840.5 with 6857.5 and 6886.5 above that.
- Support sits between 6782.5 and 6773.5, with 6752.5 and 6689.5 below that.
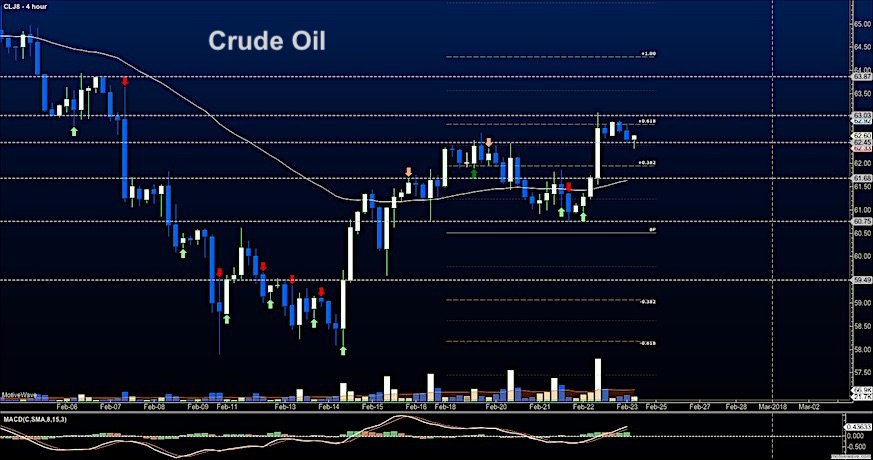
WTI Crude Oil
Price rebounded nicely after the EIA report and we hold above our bullish levels near 62.3. A retest of support seems plausible near 61.8 and we still look like we are caught in ranges. Price expansion should be jagged so don’t chase your trades here. The bullets below represent the likely shift of intraday trading momentum at the positive or failed tests at the levels noted.
- Buying pressure intraday will likely strengthen with a positive retest of 63.05
- Selling pressure intraday will strengthen with a failed retest of 61.6
- Resistance sits near 63 to 63.57, with 63.8 and 64.9 above that.
- Support holds near 62.3 to 62.02, with 61.87 and 61.16 below that.
Twitter: @AnneMarieTrades
The author trades stock market futures every day and may have a position in mentioned securities at the time of publication. Any opinions expressed herein are solely those of the author, and do not in any way represent the views or opinions of any other person or entity.


