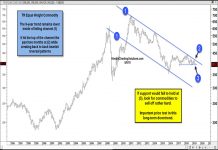
Here’s Why Commodities Are Ready For A Big Move
The commodity complex has been caught in a decline for the past several years.
Now that doesn't mean that there haven't been trading opportunities in...
Canadian Dollar Currency Research: The Long and Short
Our team has spoken at well over 100 client events over the past five years and, by far, the most common question we’ve encountered...
Does Crude Oil Have One More Move Higher?
The latest decline in crude oil prices may be offering another "trading" opportunity on the long side.
We are getting long WTI based on the...
Stock Market Today: Bears Kick Up Some Dust
Stock market volatility is picking up as we head deeper into the month of May.
A few twists and turns have arisen with the US-China...
Russell 2000 Index: The Ridiculous and the Sublime
Given the open today, the Russell 2000 (IWM) kicked bear’s butts and took names.
Not only did Granddad hold the fast-moving average on the daily...
Stock Market Trends Update & Outlook (Week of May 6)
THE BIG PICTURE
The stock market up-trend has been resilient. While the short-term trend was disrupted last week for a quick pullback, the broader trend...
U.S. Equities Update: Sentiment Indicators Keep Market Off Balance
The S&P 500 Index and the Dow Jones Industrial Average finished last week just short of record highs.
Stocks were supported by a host of...
Commodities Debate: New Bull Market or Prolonged Bear?
A lot is going on in markets right now with regards to commodities, emerging markets, and in particular - the US dollar.
The moves of...
S&P 500 Volatility Returns As Stock Market Cycle Winds Down
The S&P 500 (SPX) rose by 6 points last week, an increase of 0.2%
The market slipped when Powell did not affirm intentions to cut...
Weekly Stock Market Outlook: Bull Trend Hits 17 Weeks
The S&P 500 maintained its strong bullish posture and long-term Market Sentiment with a near-term bounce late in the week following an earlier bullish...


