THE BIG PICTURE
The stock market up-trend has been resilient. While the short-term trend was disrupted last week for a quick pullback, the broader trend is still up.
Below is my monthly, weekly and daily trading charts with an updated stock market trends outlook. Let’s begin today’s update by looking at chart of a broad stock market index, the S&P 500.
Current Technical Trends – Week of May 6, 2019
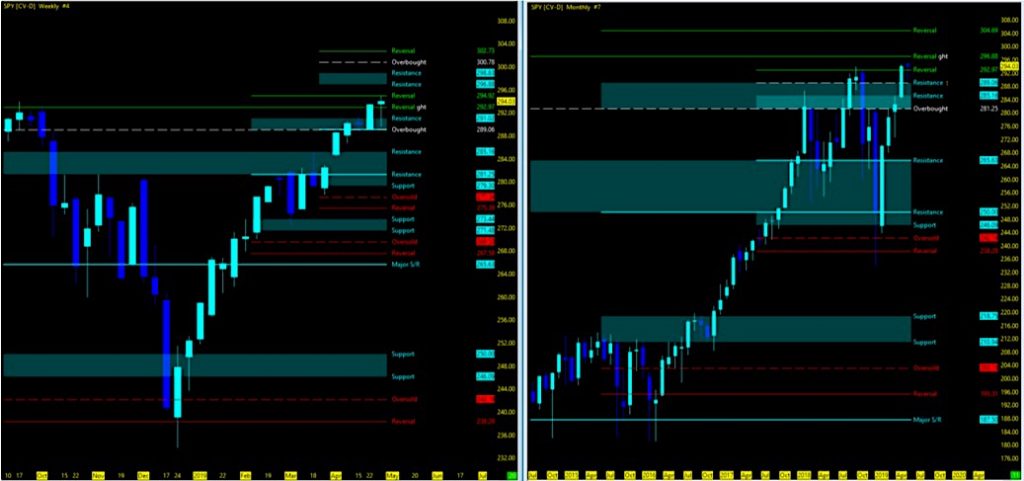
$SPY S&P 500 Weekly/Monthly Charts
Attempting to determine which way a market will go on any given day is merely a guess in which some will get it right and some will get it wrong. Being prepared in either direction intraday for the strongest probable trend is by plotting your longer term charts and utilizing an indicator of choice on the lower time frame to identify the setup and remaining in the trade that much longer. Any chart posted here is merely a snapshot of current technical momentum and not indicative of where price may lead forward.
$SPY S&P 500 Daily Chart
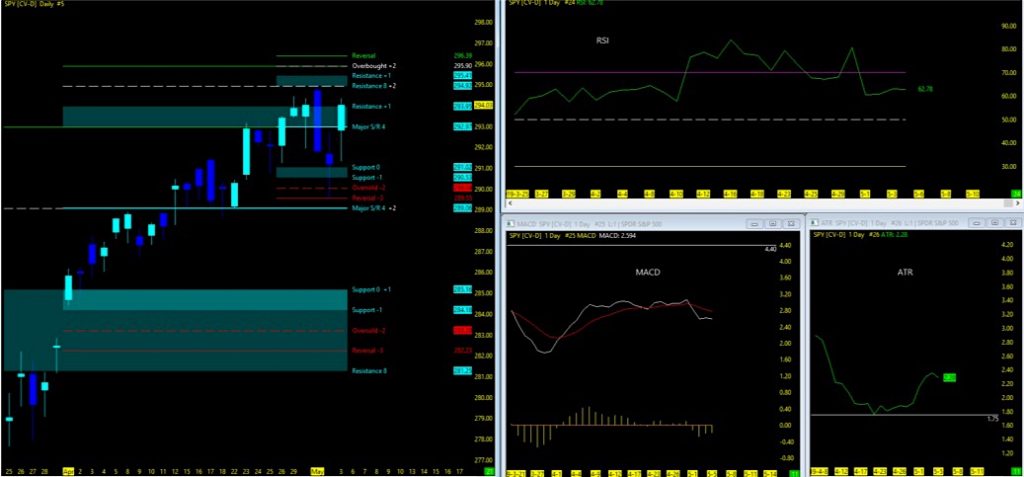
Here’s a summary trend analysis of the S&P 500:
- $SPY (60m/4hr) on progressive move to MML highs after bounce off midweek lows
- 60 day MML range at overbought/reversal gap – Uptrend
- 90+ day MML range holding just above reversal – Uptrend
- Long Term MML back at all time highs with 302/304 reversal level upside
- Price action holding above moving averages
- 10ma>50ma>100ma>200ma; in sync
- 10 day EMA broken on May 2nd since support above on March 29th; back above
- 5/10ema crossover upside holding since March 29th
- RSI back under oversold
- Average trading range closes out at 2.28 after 4/23 lows
- MACD pullback continues, gap spread steady, histogram under 0
- VIX continues to vacillate around 13-15; Closes at high 12’s
Current Trends of key ETF indices can be FOUND HERE
Key Events in the market this week:
- Economic Indicators: CPI, JOLTS
- Fed Speakers, Powell
- Earnings:
- Disney, Lyft, Etsy
- Energy Sector reports
- China Trade deal deadline
- Micro futures market opens (CME)
The Bottom Line:
Downside Probability: With price action at MML highs on longer term charts with still room to move to reversal tops (300-305), the RSI and MACD leaning down, the momentum surely has reason to pullback. With the China trade deadline on the table and today’s Globex reaction, we may just see that play out before we go higher.
Upside Probability: 60m/4hr chart momentum off last weeks lows are showing progressive move upwards. Moving averages in sync and earnings remaining strong. Long term charts remain consolidated at MML highs. Supporting ETF’s including Industrial/Transports remain upside.
Big Picture Market Pulse: The big pic long term still has room to move up and I firmly believe based on my chart analysis that we are in for another move up. However, we all know with markets, a pullback is always good before the next move higher. With this latest run up since the end of March from MML lows to the highs, gives an opportunity for all indicators to reset and project new highs for what its worth.
Thanks for reading and remember to always use a stop at/around key technical trend levels.
Twitter: @TradingFibz
The author trades futures intraday and may have a position in the mentioned securities at the time of publication. Any opinions expressed herein are solely those of the author, and do not in any way represent the views or opinions of any other person or entity.

: Worrisome to Broader Market?")


