The S&P 500 Index and the Dow Jones Industrial Average finished last week just short of record highs.
Stocks were supported by a host of economic data including the Labor Department’s report that the economy added a seasonally adjusted 263,000 jobs in April and joblessness fell to 3.6%, the lowest level since 1969.
With the combination of a healthy (but slowing) economy with low inflation and no recession in sight, many corporations reporting better-than-expected earnings reports, and an accommodative Federal Reserve suggests that the stock market has more room to go.
Conversations are set to continue this week between the U.S. and China regarding the possibility of a trade deal with China. The White House announced yesterday the possibility of increased tariffs on $200-billion of Chinese goods in an effort to encourage a deal.
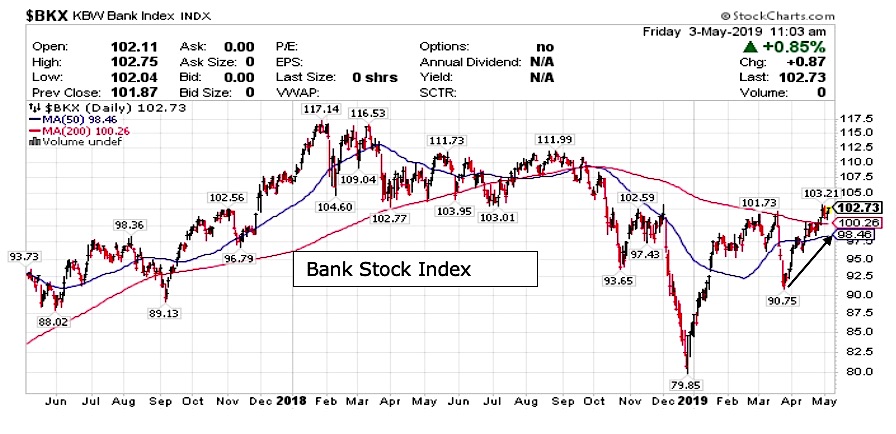
With the stock market at all-time highs, this will likely cause some jitters in the markets this week. We have been advising our clients this year to stay with the strongest sectors of the market. The employment and wage numbers should continue to help the consumer discretionary, consumer staples, financials, technology, communication services and industrials sectors.
Additionally, with short-term Treasury bill yields at 2.41%, there is a reasonably attractive place to park the cash portion of a portfolio.
The weight of the technical indicators argue that a short-term pullback cannot be ruled out. Investor sentiment data is showing a return of investor optimism, which is bearish from a contrary opinion stance.
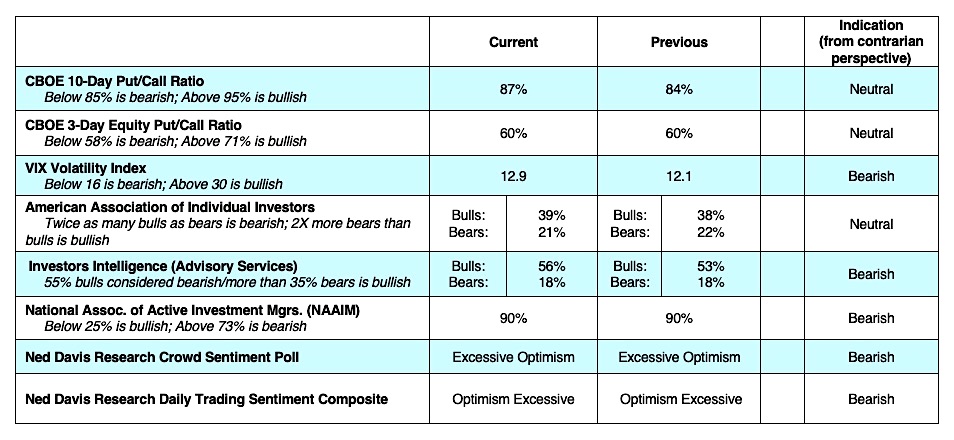
Although optimism has yet to reach an extreme, the latest data shows investor psychology is moving in that direction. This is seen in the most recent report from Investors Intelligence (II) which tracks the opinion of Wall Street letter writers. The II data shows a jump in bulls to 56%, a new high for the year. The 2019 readings are up considerably from just 29.9% bulls the final week of 2018. This contrasts to the bearish camp that has declined to just 18%, which is about where it stood at the September 2018 peak. The Ned Davis Daily Trading Sentiment Composite tells a similar tale currently sitting in the excessive optimism zone.
The weakness in stock market breadth, despite new highs by the S&P 500, cannot be ignored. Only 10% of the S&P 500 stocks have made a new high indicating that only a handful of large-cap tech stocks are carrying most of the load.
Twitter: @WillieDelwiche
Any opinions expressed herein are solely those of the author, and do not in any way represent the views or opinions of any other person or entity.


