The S&P 500 (SPX) rose by 6 points last week, an increase of 0.2%
The market slipped when Powell did not affirm intentions to cut interest rates and then gained it back on strong job numbers
Our projection this week is for stocks to chop around and then decline, perhaps below 2900.
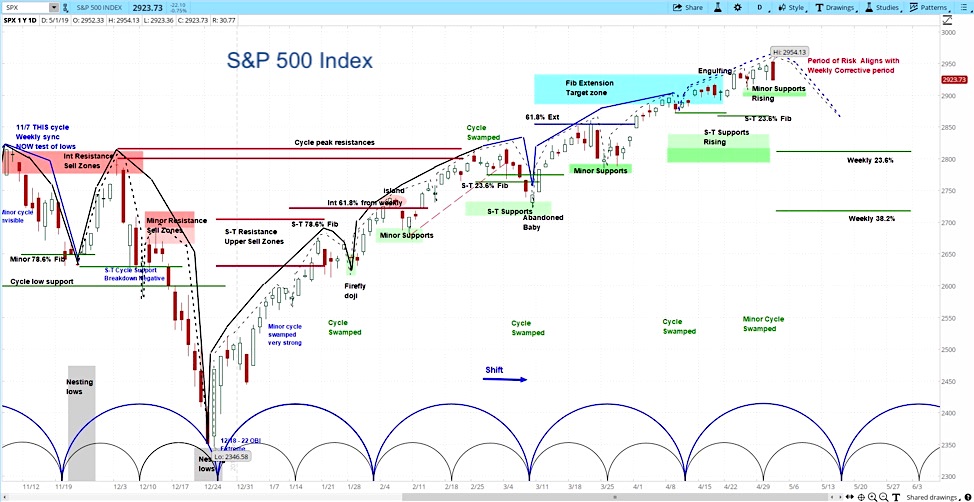
S&P 500 (SPX) Daily Chart
Our approach to technical analysis uses market cycles to project price action. Our analysis of the S&P 500 is for stocks to begin to roll over, as shown on the chart above.
We may see some choppy action early in the week. However, we expect a failure by week’s end, perhaps pushing SPX below 2900.
Market Week Video – May 5, 2019
The great bull run of 2019 paused mid week, only to come suging back by 1% on Friday, erasing the week’s losses, as I pointed out in the latest Market Week show.
Fed Chair Jerome Powell disappointed market participants by not acknowledging the need for a reduction in interest rates. More specifically, he described low inflation as “transitory” rather than “persistent,” suggesting an expectation that higher inflation rates would return. A drop in SPX of 28 points in two days suggested investors expected more talk of a rate cut.
Speaking of the Fed, President Trump wants to appoint more dovish officials to its governing board. However, he tweeted last week that his most recent pick Stephen Moore has “withdrawn” his name from consideration. This occurred however just after Moore had appeared on Bloomberg, insisting that he was “all in”.
Earnings season continued to push stocks in both directions. For example, Apple (AAPL) gained 5% on Tim Cook’s comments about potential in the Chinese market, while Google (GOOG) tanked 10% after a significant revenue miss. While 76% of companies have beat earnings expectations, this occurred as they continue to lower guidance by a ratio of 4:1, according to FactSet.
Looking at the global macro data, we continue to see a mixed picture. On the one hand, manufacturing PMI was slower than expected in the US, China, UK, and Germany. On the other hand, consumer confidence and nonfarm payrolls in the US came out stronger than expected, even as manufacturing job growth has been flat for several months.
For more from Slim, or to learn about cycle analysis, check out the askSlim Market Week show every Friday on our YouTube channel.
Twitter: @askslim
Any opinions expressed herein are solely those of the author, and do not in any way represent the views or opinions of any other person or entity.


