Energy Sector (XLE) Front Running Oil Prices
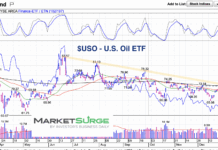
Last week I highlighted the U.S. Oil ETF (USO) and its set up to move higher.
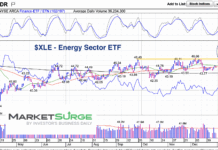
Today, we look at the Energy Sector ETF (XLE)...
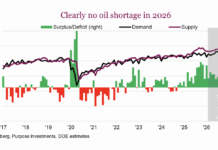
Will Crude Oil Supply Keep Price In Check?
The price of oil is pretty much near a five-year low, in a world where everything costs much more than it used to.
Thankfully, our cars...
Are Oil Prices Setting Up For A Move Higher?
Over the past several months, I've been surprised to see oil prices remain stagnant in the face of geopolitical events.
Ukraine/Russia, Israel/Iran. Crude oil has...
Natural Gas (UNG) Testing Lows After Price Reversal
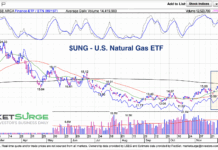
Natural gas prices seemed to be ready to rally in November... but then came a hard price reversal lower in early December.
That reversal, when...
Why Oil Prices Could Defy Sellers and The Bears
What has been weighing on oil prices?
A stronger dollar
Firm interest rates
Slower US factory activity (4 month low) because of tariffs
Talk of Russia-Ukraine Peace deal-allowing...
The Inflation Trifecta: Fiat Currency, Precious Metals, and Fuel
The trifecta of inflation” usually refers to the three core drivers that push inflation higher at the same time, creating a stronger and often...
Energy ETFs Update: 50-Daily Moving Averages Important
While nuclear, coal, solar, and hydrogen power stocks and ETFs have done well,
Oil and gas, our more traditional and somewhat abundant resources traded through...
Energy Sector ETF (XLE): Creating Bullish Divergence?
Here are the top 10 holdings of the S&P Energy Sector ETF (NYSEARCA: XLE) as of July 24, 2025, along with their respective weightings:
Data according...
How Low Can Natural Gas Prices Go?
I did this research using AI when I asked the question:
Can natural gas producers afford to extract gas if price is below 4?
Whether natural...
Oil Prices Trading In Important Price Range
Now that the stock market calendar range for July is set, let’s look at crude oil futures.
First, there is the chart of the United...

