S&P Futures Decline Into Primary Bounce Zone
The futures market is down for the fourth day breaking through important support and holding below 1968.
China’s markets were halted due to a sharp dip...
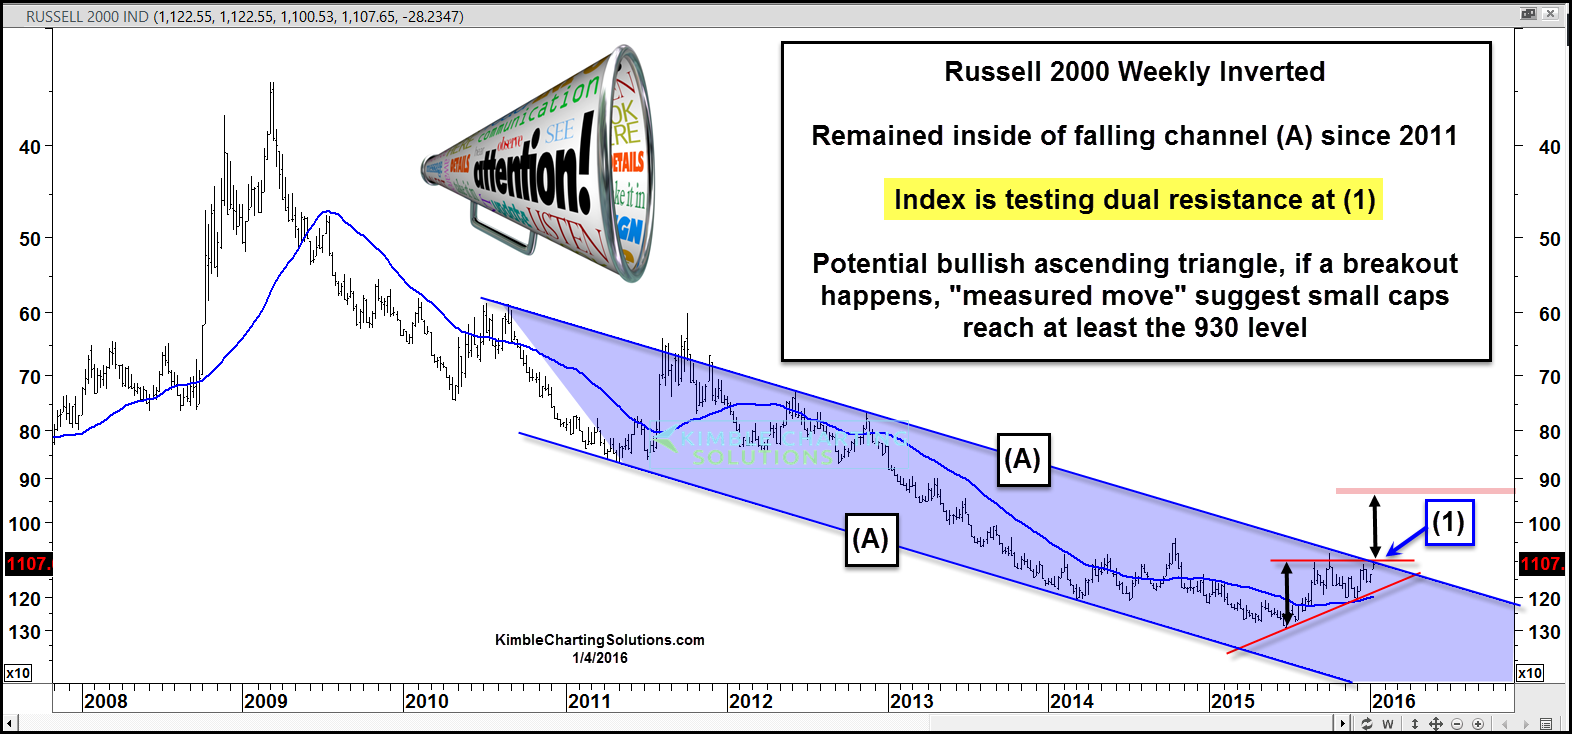
Russell 2000 In Trouble? Inverted Chart Highlights Major Test
The Russell 2000 and small caps stocks spent 2015 largely underperforming their large cap brethren (i.e. the S&P 500). And that has brought the...
9 Market Themes To Watch Heading Into 2016
First of all, I want to say that the purpose of this post is not to make predictions about the future, so if you're...
S&P 500 Market Update: Selloff Tests Key Support Level
The S&P 500 bounced off a key technical support area yesterday around 1,990. This zone represents key chart support as well as the top of the...
S&P 500 Futures Lower: Will Support Hold This Time?
The Morning Report: Will Support Hold This Time?
The futures markets are sharply lower this morning as traders move in to test support of S&P...
The Morning Report: S&P 500 Futures Rally Past Resistance
The S&P 500 futures rally is evolving this morning as the ES_F recovered its downward retrace to breach resistance in overnight trading – it...
The Morning Report: S&P 500 Futures Price Support Levels For Today
S&P 500 futures have begun a downward retrace after moving sharply higher into the 10 sma weekly and 50 sma daily moving averages that I...
The Morning Report: S&P 500 Futures Eyeing Key Resistance
S&P 500 futures for December 23 are continuing a recovery in our Santa rally – with charts and trading looking above at price resistance...
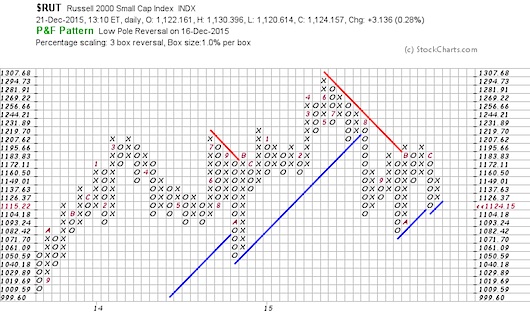
Point & Figure Signals Mixed For Major Stock Market Indices
One of my favorite methods of charting is with Point & Figure charts. Today, I'd like to do a quick recap of the major...
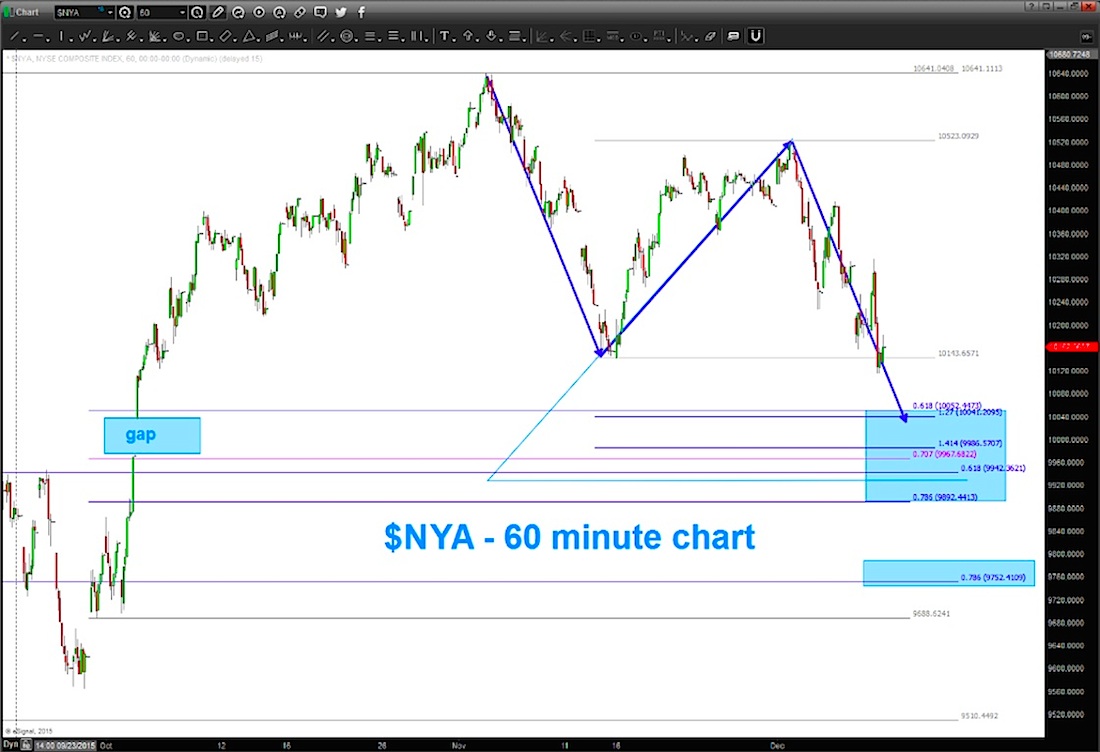
NYSE Composite Index Declines Into Key Price Support
The majority of investors follow the stock market via the Dow Jones Industrial Aveage, S&P 500, and Russell 2000.
Make no mistake, these are all...


