The S&P 500 bounced off a key technical support area yesterday around 1,990. This zone represents key chart support as well as the top of the double bottom breakout.
Since early November, the “500” has been in a clear downtrend, and with yesterday’s selloff, the S&P 500 has undercut trendline support off the September low. If this 1,990 region gets taken out, there are two more possible S&P 500 support levels that the bulls will need to hold:
- The bottom of the channel sits in the 1,970 area looking out a few days.
- In addition, a 61.8% retracement of the rally since September targets the 1,965 zone.
So for the bulls, there could be one more low before this pullback ends.
For the bears to run wild here, we probably have to see continued weakness in early 2016 that obliterates the two S&P 500 support levels (1,965/1,970) I just talked about. One Elliott Wave count is looking for a large decline early this year so an end to the bull market is something to consider if we see major downside follow through.

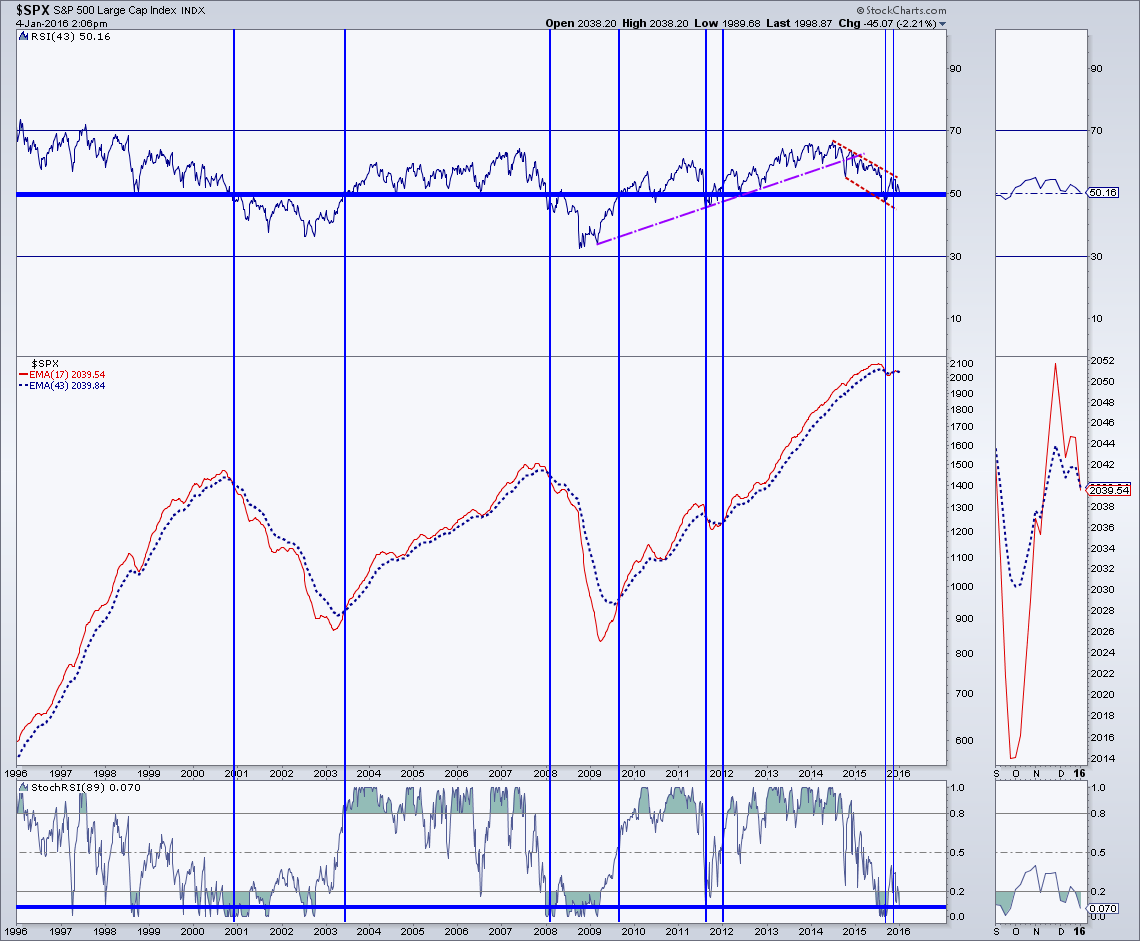
I modified my weekly S&P 500 chart to make it a bit clearer. I removed the price from the chart and just show the 17-week and 43-week exponential moving averages and added a thumbnail to the right side that enhances recent action. The 17-week is starting to fall below the 43-week for the second time since September.
In addition, long-term momentum (43-week RSI) is nearing the bull/bear market demarcation of 50. Above 50, bull market, below 50 major correction or bear market. So 50 is a key S&P 500 support level with regards to RSI.
Thirdly, long-term stochastics dipped into extreme oversold territory late last year like it did during the past two bear markets. Notice that it did not do this in 2011 (resolution was bullish). However, this long-term momentum read did cycle into extreme oversold territory in 1998 (and resolution was higher). Nothing works all the time.
As of Friday ‘s close , overall market sentiment was still not set up for a big, sustainable rally. Price Weakness = Increased Pessimism. Extreme price weakness translates to extreme pessimism more quickly. Something to think about.
Twitter: @MarkArbeter
The author does not have a position in any mentioned securities at the time of publication. Any opinions expressed herein are solely those of the author, and do not in any way represent the views or opinions of any other person or entity.
: Creating Bullish Divergence?")


 and Semiconductors (SMH): Concerning Price Pattern?")


