S&P 500 futures have begun a downward retrace after moving sharply higher into the 10 sma weekly and 50 sma daily moving averages that I follow.
S&P 500 futures charts should see trading into 2038 if selling pressure holds. Futures resistance sits near 2055.5, while price support sits at 2038. Breaks of either support or resistance must be confirmed, and if broken, will bring directional momentum into the charts intraday. We have a bearish formation in the shorter cycles and time frames of the charts that suggests pullbacks into support.
Our pattern of higher lows and higher highs from prior days is breaking. That means we have a potential trend shift in S&P 500 futures into support levels below.
Shorter time frame momentum indicators are mixed, and lower than Friday. Longer cycles are upward trending but inflecting in positive territory.
See today’s economic calendar with a rundown of releases.
RANGE OF TUESDAY’S MOTION
Crude Oil Futures (CL_F)
Resistance near 38.20 on Friday has held today. The WTI contract now sits near support at this writing. There is a bounce zone between 38.9 and 37.1 but bearish action showing for intraday cycles this morning. The bigger picture shows a pullback into support that should bounce and hold. Pullbacks are consistently being bought and prices are forming higher lows and higher highs on longer intraday time frames. Support has moved up into between 36.4 to 36.6. The chart is trying to create a bigger basing formation.
Resistance lies near 38.18 -38.6, then 39.7-40.20, if that is breached and holds. Bearish action is more likely beneath 37.7, and bullish action is more likely to continue above 38.1. I suspect buyers are looking at 37.2 to hold. Trend and momentum are mixed across time frames. Breach above a 37.7 sends us to congestion near 38.1-38.3, and perhaps 38.6. Below a 34.1 failed retest sends us to 36.65, 36.26, 35.85, and 35.69. Momentum on longer time frames is positive and falling.
E-mini S&P 500 Futures (ES_F)
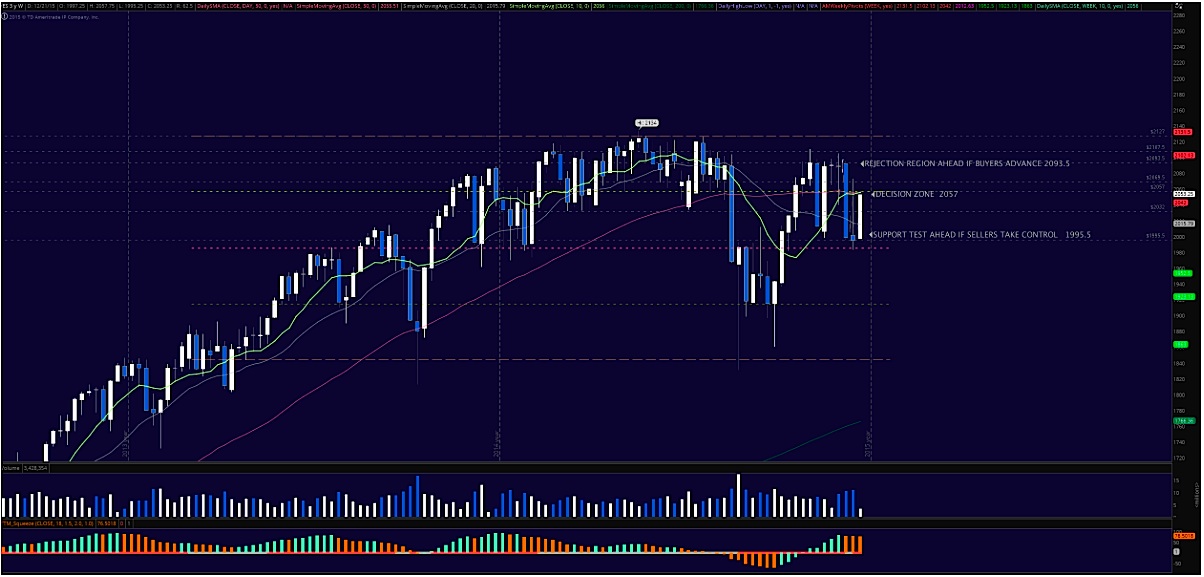
This week’s chart with active S&P 500 futures price support and resistance trading levels. Click to enlarge.
Upside motion is best setup on the recapture of 2049– or a bounce off support at 2039.75. A bounce off 2039.75 makes a reasonable setup with targets near 2042.5, and 2045.75, but watch 2049 for sellers to advance their agenda. The breach of 2051 will likely advance buyers and bring more upside into resistance above at 2055- watch momentum carefully here as very firm resistance sits above for now at the 2055 area.
Downside motion below the failed retest of 2049, or at the failure to hold 2042. Retracement into lower levels from 2049 gives us the targets at 2045.75.75, 2042.5, 2039.75, 2038, 2034.5, and perhaps 2032.5. Short action intraday is trending currently unless we have a bounce and hold over 2051.
If you’re interested in the live trading room, it is now primarily futures content, though we do track heavily traded stocks and their likely daily trajectories as well – we begin at 9am with a morning report and likely chart movements along with trade setups for the day.
As long as the trader keeps himself aware of support and resistance levels, risk can be very adequately managed to play in either direction as bottom picking remains a behavior pattern that is developing with value buyers and speculative traders.
Twitter: @AnneMarieTrades
The author trades futures every day and may have a position in mentioned securities at the time of publication. Any opinions expressed herein are solely those of the author, and do not in any way represent the views or opinions of any other person or entity.


