The S&P 500 futures rally is evolving this morning as the ES_F recovered its downward retrace to breach resistance in overnight trading – it has breached the 10 sma weekly and 50 sma daily moving averages that I watch.
It should retest this area around 2055 but if momentum holds, the S&P 500 futures rally should see higher levels. The support area remains the same.
REMEMBER –My support and resistance levels are for intraday trading. If a chart breaks the level, it is likely to retrace into the level before a real decision is made. Yesterday, we saw a breach of the support level, but on the retrace it held. That’s where the trending trade begins – at the successful retest in the direction of the break.
Intraday resistance sits near 2060.5. Intraday support sits at 2048. Breaks of either support or resistance must be confirmed, and if broken, will bring directional momentum into the charts intraday. The S&P 500 futures rally has a bullish formation within shorter cycles and time frames on the charts and that suggests pullbacks into support.
Shorter time frame momentum indicators are positive, and higher than Monday. Longer cycles are upward trending and holding in positive territory.
See today’s economic calendar with a rundown of releases.
RANGE OF TUESDAY’S MOTION
Crude Oil Futures (CL_F)
Resistance for Crude Oil is near 37.2 and being tested. Charts have bounced back and forth most of the day after fading into support near 36.6. The bigger picture remains the same -a pullback into support that should bounce and hold. Support is still between 36.4 to 36.6. The chart is trying to create a bigger basing formation.
A squeezing action is now showing on tighter time frames so resistance lies near 37.2 -37.4, then 37.7-38.20, if that is breached and holds. Bearish action is more likely beneath 36.7, and bullish action is more likely to continue above 37.2. I suspect buyers are looking at 37.2 to hold if we can get back above this level. Trend and momentum are mixed but lifting across time frames. Breach above a 37.1 sends us to congestion near 37.23-37.43 and perhaps 37.7. Below a 36.7 failed retest sends us to 36.53, 36.38, 36.16, 35.85, and 35.69. Momentum on longer time frames is positive and holding.
E-mini S&P 500 Futures (ES_F)
This week’s chart with active S&P 500 futures price support and resistance trading levels. Click to enlarge.
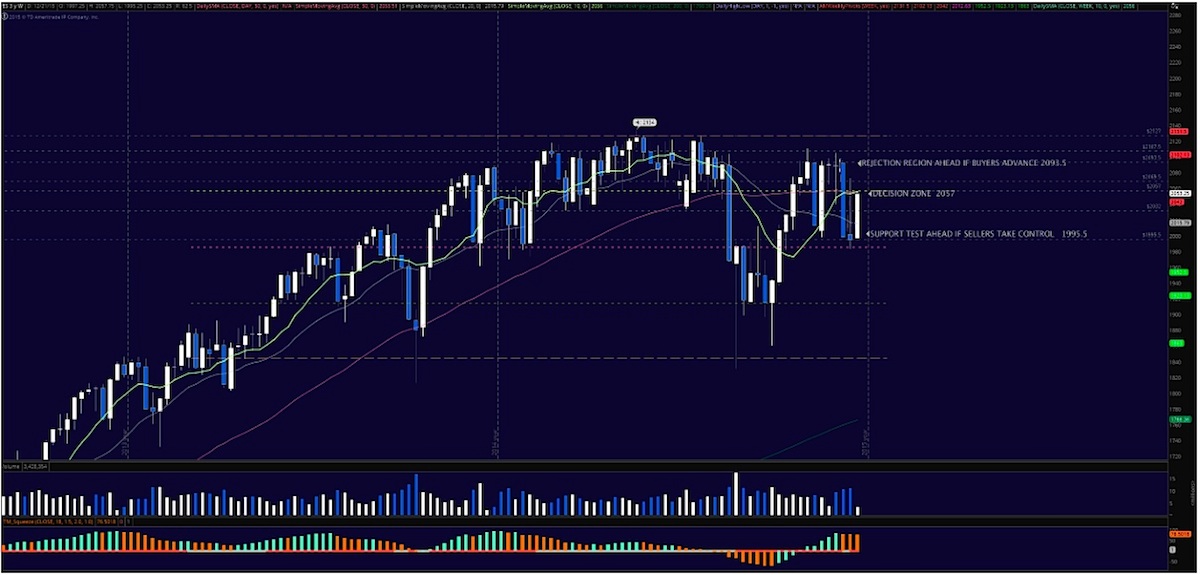
Upside motion is best setup on the bounce off 2054.5– or a breach of 2060 (as long as momentum is holding). A bounce off 2054.5 makes a reasonable setup for the S&P 500 futures rally with targets near 2057.5, and 2060. But watch 2060 for sellers to try to reverse the trend. A breach of 2061 will likely advance buyers and bring more upside for the S&P 500 futures rally into resistance above at 2068.
Downside motion below the failed retest of 2054, or at the failure to hold 2064.5 opens the short. Retracement into lower levels from 2053 gives us the targets at 2050.75, 2049, 2045.75, 2042.5, 2038.75, and perhaps 2034.5.
Long action intraday is trending currently unless we have a failure and failed retest of 2038.
As long as traders keep themselves aware of support and resistance levels, risk can be very adequately managed to play in either direction as bottom picking remains a behavior pattern that is developing with value buyers and speculative traders.
Twitter: @AnneMarieTrades
The author trades futures every day and may have a position in mentioned securities at the time of publication. Any opinions expressed herein are solely those of the author, and do not in any way represent the views or opinions of any other person or entity.


