The majority of investors follow the stock market via the Dow Jones Industrial Aveage, S&P 500, and Russell 2000.
Make no mistake, these are all important. But when I want to get a really good look at the broader stock market, I use the NYSE Composite Index (New York Stock Exchange).
Why?
The following is from Wikipedia on the New York Stock Exchange:
“The NYSE Composite is a stock market index covering all common stock listed on the New York Stock Exchange, including American depositary receipts, real estate investment trusts, tracking stocks, and foreign listings. Over 2,000 stocks are covered in the index, of which over 1,600 are from United States corporations and over 360 are foreign listings; however foreign companies are very prevalent among the largest companies in the index: of the 100 companies in the index having the largest market capitalization (and thus the largest impact on the index), more than half (55) are non-U.S. issues.[1] This includes corporations in each of the ten industries listed in the Industry Classification Benchmark. It uses free-float market cap weighting.”
The NYSE Composite Index is big, broad, and offers a good feel for the overall market.
The chart below is a couple days old, but offers some very good insights into the current NYSE Composite decline… and where the market may reverse higher. When taking today’s decline lower into consideration, the NYSE Composite Index is nearing a VERY important area of price support (shown below).
IF YOUR A BULL THEN THIS IS THE AREA TO GET LONG (with a stop). If the level fails then something is not right.
Often times, traders get in trouble trying to rationalize it when all we need to have a plan.
It’s been an amazing 6 year bull run. And, as a PATTERN recognition swing trader, the rules state to BUY the first PATTERN that comes along. Well, since August, this is the “cleanest” buy PATTERN to come along.
Readers of mine are also familiar with the fact that sometimes the patterns are PERFECT and SPOT ON. At other times, they slip thru some price levels but ultimately continue on.
So the question here is: Where is the current “bull” thesis wrong for the stock market? Right now, those August lows are the key to keeping this bull market alive (in my opinion).
NYSE Composite Index – 60 MIN Chart
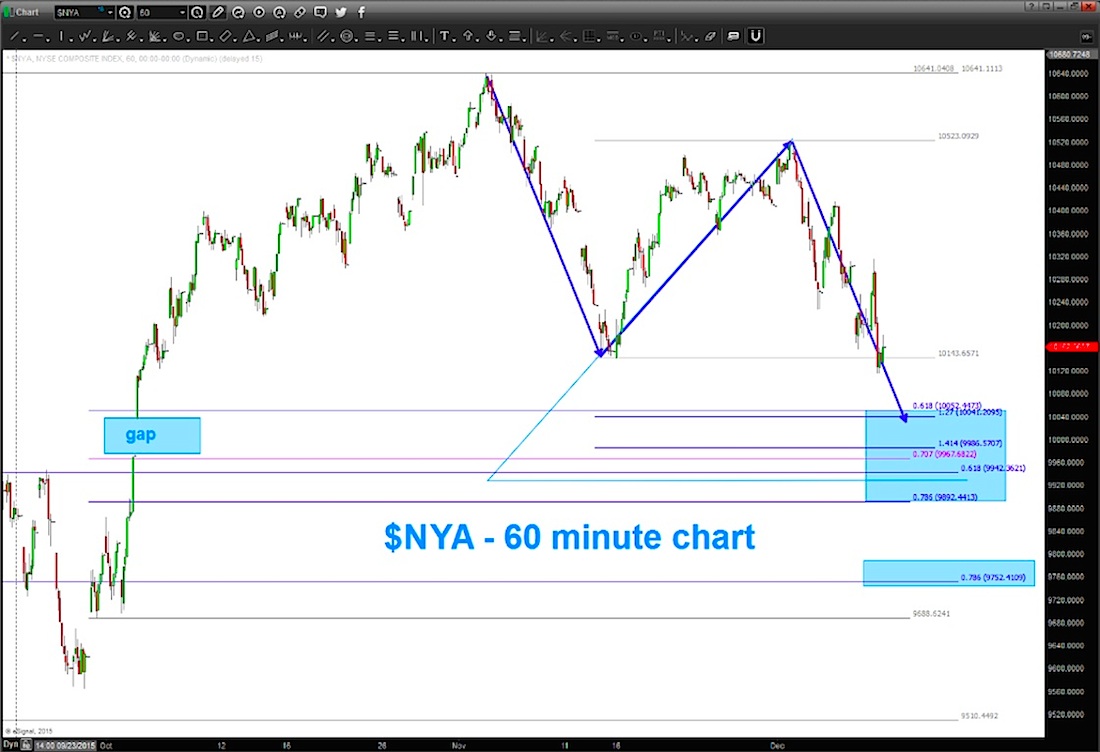
The selling that is occurring today is in line with the pattern above. As well, the NYSE Composite Index is getting right into the price levels and support areas that highlight where the pattern will end.
Watch these levels on the NYSE Composite Index. If we are going to rally higher, these levels should hold. If not, well, hunker down for the time being.
Twitter: @BartsCharts
Read more from Bart on his blog.
Author does not have a position in mentioned securities at the time of publication. Any opinions expressed herein are solely those of the author, and do not in any way represent the views or opinions of any other person or entity.

: Showing Some Signs of Emerging Strength")
