Stock Market Today: Indices Test Key Fib Levels Again
Stock market futures are pointing to a lower start on Wednesday morning. This follows a solid day of gains yesterday.
The two-week plus rally has...
1987 Stock Market Crash Deja Vu? Bullish If It Is!
The market action of late reminds me of what I experienced in 1987.
If we are repeating the 87 stock market crash, it could be...
Who Loves Free Money But Worries About Oil?
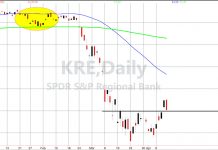
The charts of Regional Banks ETF (KRE) or the Prodigal Son of the Economic Modern Family told us and will continue to tell us...
Historic 2020 Stock Market Crash: Are Time & Price Patterns Repeating?
S&P 500 Index Chart Long-Term Chart
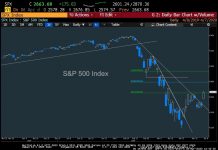
Over the past two weeks the stock market has rallied sharply, seeing the S&P 500 retrace 50 percent of...
Chart of the Week: Nasdaq 100 versus Dow Industrials Points to Market Rotation
My One Chart for today is a ratio of the Nasdaq Composite versus the Dow Jones Industrial Average.
On Twitter recently I was asked this...
Will Nasdaq 100 Index Rally Stall at Regression Trend Channel?
Nasdaq 100 Index Chart
The Nasdaq 100 Index rally is nearing strong price resistance.
Not only has the tech index rallied into its 50 percent Fibonacci...
S&P 500 Index: Is the Bear Market Rally Almost Over?
It's amazing how markets teach us about fear and greed.
The market crash in March saw major stock market indices fall over 35 percent.
And the...
Stock Market Only as Good as Its Lowest Common Denominator
In the spirit of objectivity, we looked at the weekly chart of the Russell 2000 ETF (IWM) as either a bear flag forming, or...
Is the Russell 2000 Index Bear Flag Setup a Warning to Investors?
The Russell 2000 Index and ETF (IWM) weekly chart has helped us navigate the bull and bear market runs for years.
While you hear so...
S&P 500 Index Reversal Higher Breakout Points to 2750-2800
S&P 500 Index Trading Outlook (3-5 Days): Bullish
A move over 2562 is turning the trend back up.
Despite a lot of whipsaws, it looks right...


