In the spirit of objectivity, we looked at the weekly chart of the Russell 2000 ETF (IWM) as either a bear flag forming, or consolidation before another rally.
Then, we examined two potential cases.
Case 1: A bear flag forming where IWM breaks down under the bear flag pennant or around 105.
Or
Case 2: Consolidation before a breakout, where we get a weekly close over 116.00-117.60.
Today, the Russell 2000 ETF (IWM) cleared 117.60 closing 118.07.
Clearly, that is encouraging activity.
Nonetheless, the expression that “you are only as good as your lowest common denominator” still suggests to us, “Not so fast!”
The least or lowest common denominator is a mathematical concept. With fractions, you find the common multiple that each of the denominators can be divided into, then convert all the fractions into that denominator.
For example, 1/2 + 1/4 + 1/3 has the lowest common denominator of 12. Hence it becomes, 6/12 + 3/12 + 4/12 =13/12 or 1 and 1/12.
Simple math we learned in elementary school.
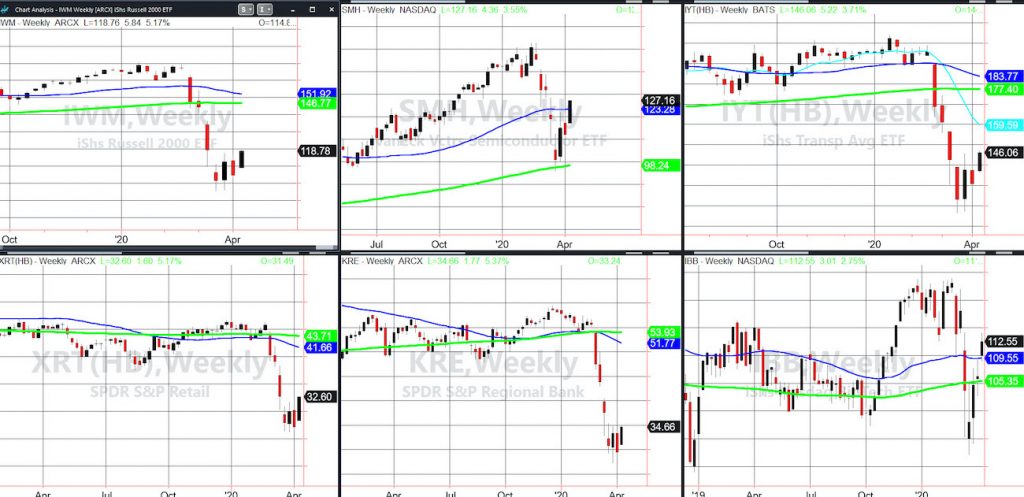
Looking at the weekly charts of the Economic Modern Family, what would you say is the lowest common denominator, or the number all of them can easily be divided by?
If you thought to yourself Regional Banks KRE, give yourself a gold star!
KRE was the first to fall into a caution phase in January. A while ago, we fathomed that it stands to reason it should also be the first to show a true bottom.
At this point, KRE is the lowest common denominator.
When does that change?
It starts with a weekly close over 35.00. Does that mean bear market over?
Depends on your timeframe. To us it means a move to 40-43 more likely. Then we reassess.
If KRE cannot clear 35 and fails 30?
The other members will quickly convert to the lowest common denominator!
Please watch today’s interview with TraderTV Live! https://www.youtube.com/watch?v=PkdWriAHNvw&t=9721s
S&P 500 (SPY) 264.50 pivotal and a move near 290 if gets there-a short (retrace to the MA breakdown)
Russell 2000 (IWM) 118-120 resistance. 115 pivotal and 110 critical
Dow Jones Industrial Average (DIA) Inside day 236.80 huge resistance and 220.50 support
Nasdaq (QQQ) Inside day. If cannot clear 202, looking for a possible short
KRE (Regional Banks) 35.00 resistance 32 support
SMH (Semiconductors) Inside day. 127.80 resistance and could be a short if fails 122.80
IYT (Transportation) Inside day. 147.21 resistance, 140.39 support
IBB (Biotechnology) Inside day. 114.10 resistance 109.31 support
XRT (Retail) Over 32.74 has a gap to fill. If cannot clear that number, 31.60 must hold
Volatility Index (VXX) Inside week-59.01-39.50 range to watch-over 45 suggests more upside
Junk Bonds (JNK) Inside week. 95.98 resistance 83.18 support
LQD (iShs iBoxx High yield Bonds) 126 is the must clear number and if fails 123 trouble
Twitter: @marketminute
The author may have a position in the mentioned securities at the time of publication. Any opinions expressed herein are solely those of the author, and do not in any way represent the views or opinions of any other person or entity.


