It’s amazing how markets teach us about fear and greed.
The market crash in March saw major stock market indices fall over 35 percent.
And the subsequent rally has seen indices rally nearly 25%.
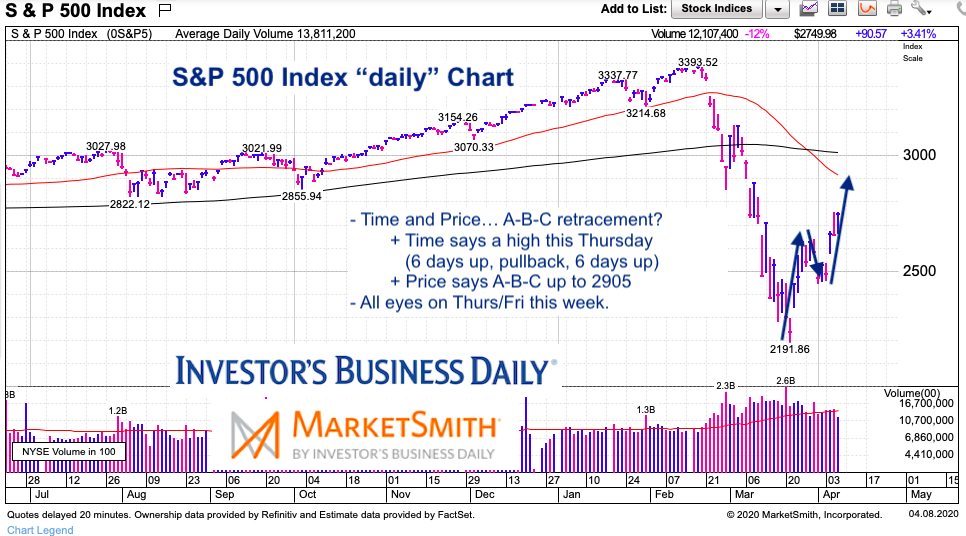
But the market doesn’t pay you to be irrational. It pays you to understand the irrational. And to be rational within the volatile price moves. In today’s chart post, I’ll highlight key time and price resistance on the S&P 500 and why the bear market rally may top out this week.
Note that the following MarketSmith charts are built with Investors Business Daily’s product suite.
I am an Investors Business Daily (IBD) partner and promote the use of their products. The entire platform offers a good mix of technical and fundamental data and education.
Chart
I shared this chart on Twitter tonight. And I think it’s important. “Time” is calling for a top Thursday or Friday. “Price” is a bit higher but I it’s uncertain if time will get there. In shore, it’s time to be cautious.
Time = 6 day rally, 2 day pullback, 6 day rally? (ending Thursday)
Price = 2191 rally up to 2641, down to 2455, and perhaps up to 2905?
Either one or both will win out. I’m not willing to bet. Note that the 50% Fib is at 2793, followed by the 61.8% Fib at 2934. There’s also the 50/200 day moving averages. Resistance looms. I’m taking caution into the weekend.
Twitter: @andrewnyquist
The author may have a position in mentioned securities at the time of publication. Any opinions expressed herein are solely those of the author, and do not in any way represent the views or opinions of any other person or entity.


 Flirting With Critical Support… Again")

