The market action of late reminds me of what I experienced in 1987.
If we are repeating the 87 stock market crash, it could be bullish, as the lows could be in play already.
In today’s 2-pack, I highlight the similarities and what to watch for.
For a more in-depth analysis, check out this video I made on April 9th.
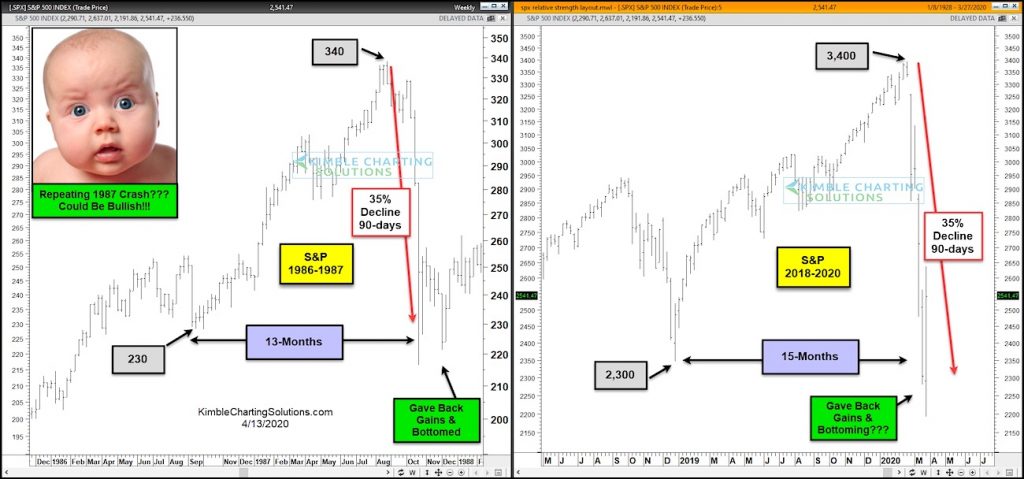
In 1986-1987 (left chart), the S&P 500 rallied from 230 to 340 over 13 months before falling 35 percent. It then rallied sharply before giving back gains and putting in a higher low.
2020 deja vu? You can’t make up the similarities in numbers! During 2018-2020 (right chart), the S&P 500 rallied from 2300 to 3400 over 15 months before falling 35 percent. We have once again rallied sharply.
Could we give back gains once again while confirming an enduring low? Bulls sure hope so! Stay tuned!
S&P 500 Chart – 1987 vs 2020 Market Crashes
Note that KimbleCharting is offering a 2 week Free trial to See It Market readers. Just send me an email to services@kimblechartingsolutions.com for details to get set up.
Twitter: @KimbleCharting
Any opinions expressed herein are solely those of the author, and do not in any way represent the views or opinions of any other person or entity.

: Showing Some Signs of Emerging Strength")
