The charts of Regional Banks ETF (KRE) or the Prodigal Son of the Economic Modern Family told us and will continue to tell us a lot!
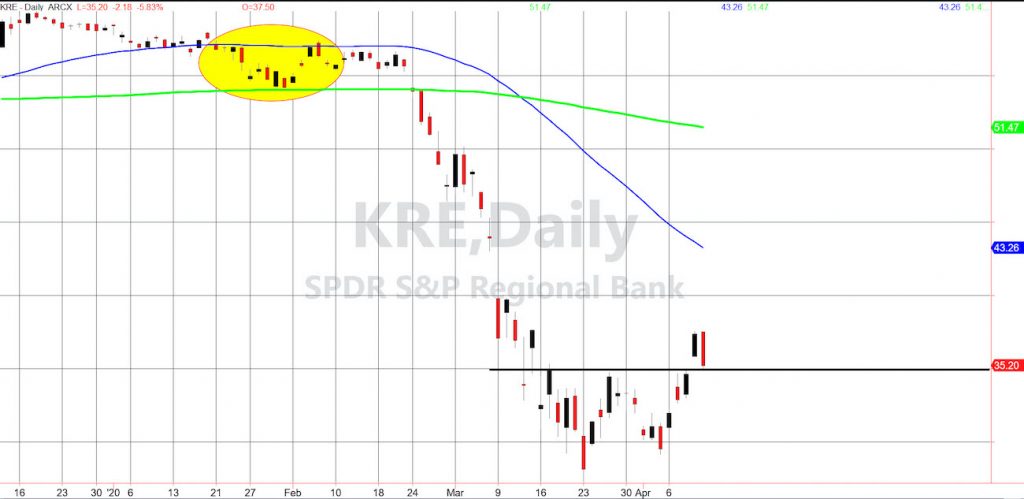
On the daily chart, back in mid-January, KRE was one of the first sectors to go into a warning phase or break below the 50-daily moving average.
Then, after a second test of the 50-Day Moving Average, it failed again in the middle of February.
What is noteworthy about that is at the very same time, the S&P 500 and NASDAQ were going to new highs.
The Regional Banks ETF (KRE) are in focus today for a few reasons.
First, bank earnings are on tap this week.
Secondly, regional banks are very much tied to oil money. Here in New Mexico, a state that depends on oil and gas for revenue, that oil is in very low demand, is troublesome.
Finally, as regional banks reflect how robust regions throughout the country are as far as folks borrowing and saving money, this sector takes a reliable pulse of the “inside” economy.
Given the Fed’s role in buying debt-both high grade and junk, why should we pay attention to our prodigal son?
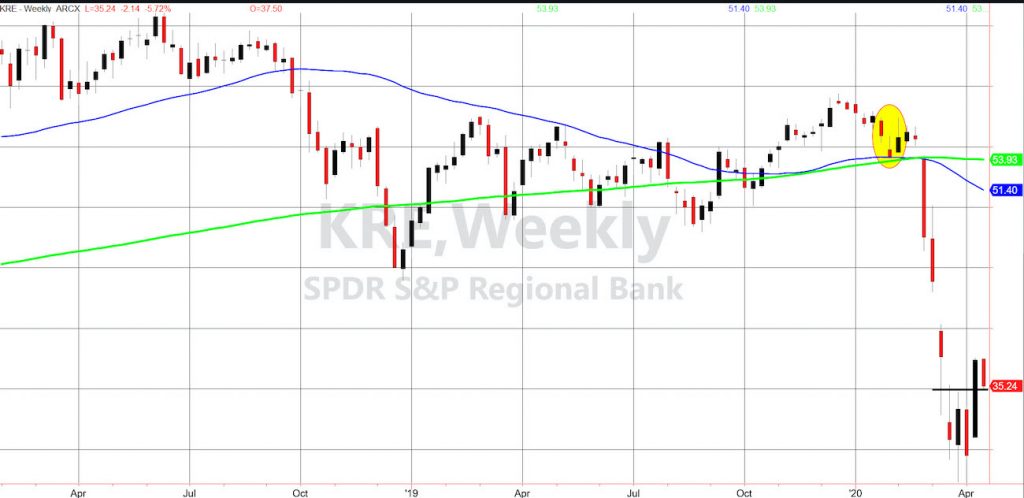
On the weekly chart, we get a bit of a different perspective.
Both the Daily and Weekly charts show how the 35.00 level was a breakout after forming a bit of base.
On the weekly chart, you see that the ellipse looks very different than it did in January-February.
At the point it was breaking down on the Daily charts, it was still above the weekly MAs.
So here is a case where the shorter timeframe gave us a signal before the longer timeframe.
To begin this week, not only are we watching the 35.00 level, but also the trading range is within last week’s trading range.
Last week’s high was 37.57.
Today’s high was 37.50.
As we begin the week’s earning’s reports and near-term future of the oil prices, the very tight range of 35.00-37.50 should be watched.
Under 35 I would say history does repeat itself which means that could be an early warning the rally is weakening.
And if KRE clears 37.57, then I would not necessarily conclude the worst is over, but at least we can assume a move to test the Daily 50-DMA is in the cards.
S&P 500 (SPY) 270 support and a move near 290.45 if gets there-a short (retrace to the MA breakdown)
Russell 2000 (IWM) 118-120 now pivotal support. 125.80 2018 November low now resistance
Dow Jones Industrial Average (DIA) 236.80 the pivotal 200-week moving average to watch.
Nasdaq (QQQ) With KRE down 5.6% today, this rose by 1%. 205.45 the 50-DMA with 200 now pivotal support
KRE (Regional Banks) 35.00 pivotal
SMH (Semiconductors) 123.25 key support and if cannot clear 128.60, watch for a rotation out of this sector
IYT (Transportation) 150 resistance 138.50 support
IBB (Biotechnology) 110-115 range to break
XRT (Retail) 30 now support to hold 36-38 big resistance
Volatility Index (VXX) 59.01-39.50 range to watch-over 45 suggests more upside, under 40 not so much
Junk Bonds (JNK) Rallied right into resistance at 102.40. 101.40 the 50-DMA
LQD (iShs iBoxx High yield Bonds) Inside day. 126 now key support-135 resistance
Twitter: @marketminute
The author may have a position in the mentioned securities at the time of publication. Any opinions expressed herein are solely those of the author, and do not in any way represent the views or opinions of any other person or entity.


