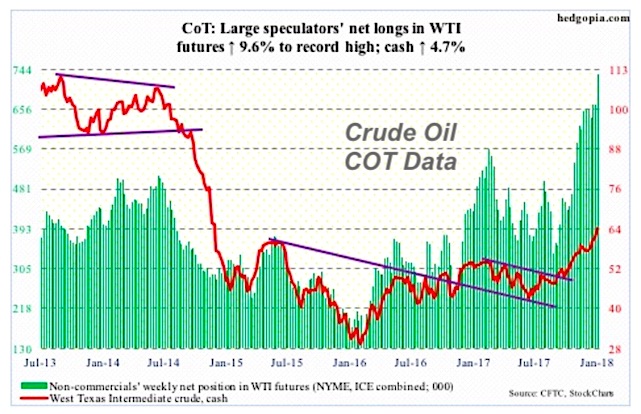
Crude Oil: Large Speculators Most Net Long Ever
The following chart and data highlight non-commercial commodity futures trading positions as of January 9, 2017.
This data was released with the January 12 COT...
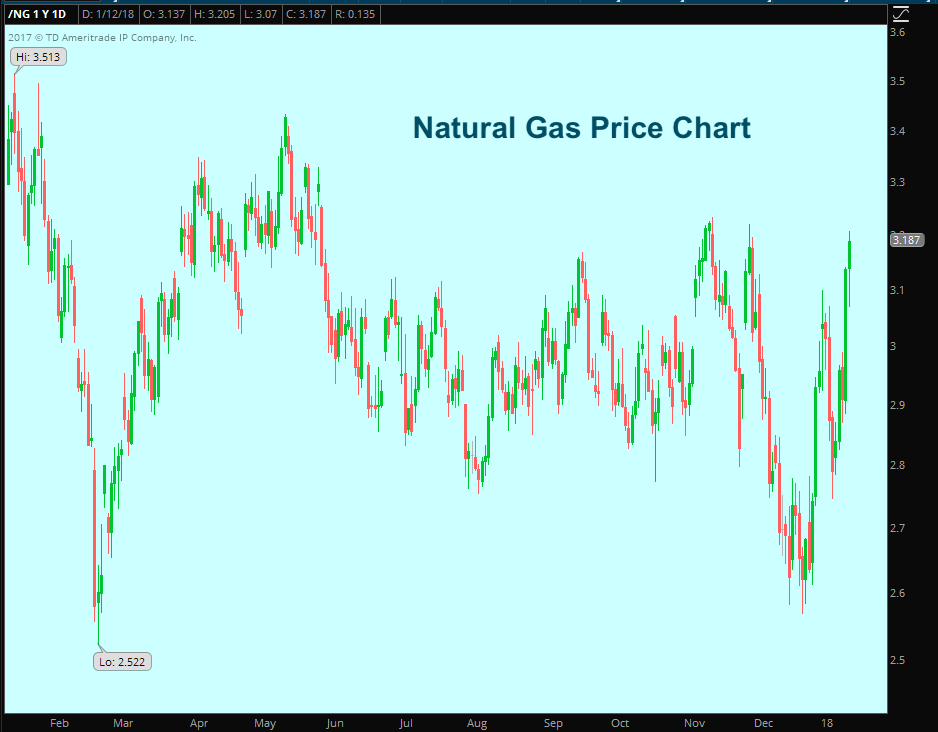
Natural Gas Update: Cold Weather Brings Heavy Demand
Prompt-month Henry Hub Natural Gas prices have traded up 30 cents in the last 2 days as cold weather looms next week.
And this comes...
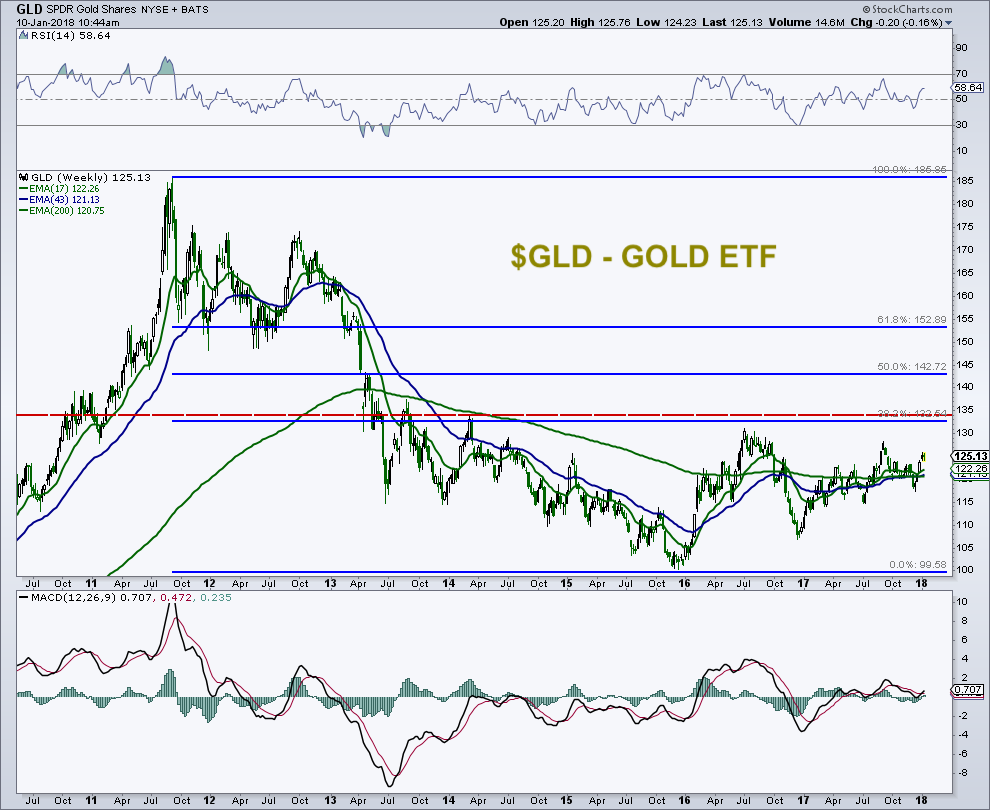
Precious Metals Update: Gold Bulls Patiently Waiting
The iShares Gold Trust (GLD) rallied into year-end and is now in a consolidation. Gold bulls (especially near-term) are patiently waiting for its next...
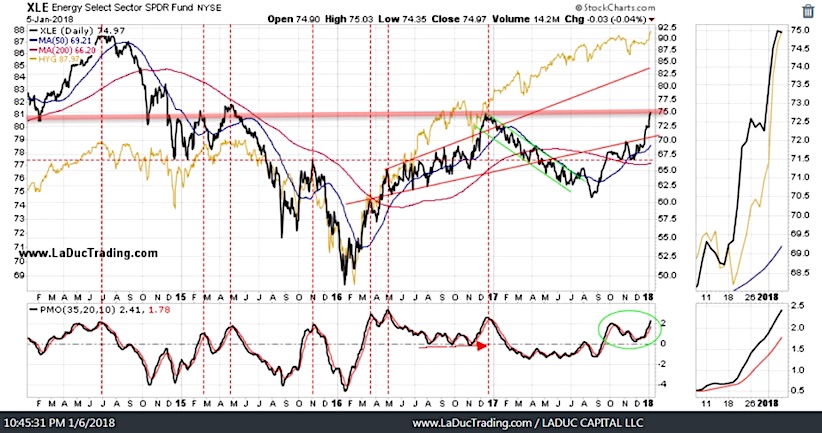
Macro To Micro Trading Update: Market Themes & Insights
Note that this post went out to my “Gone Fishing” newsletter subscribers this weekend. You can subscribe here.
Reflections and Inflections
The Bloomberg Commodity Index started the...
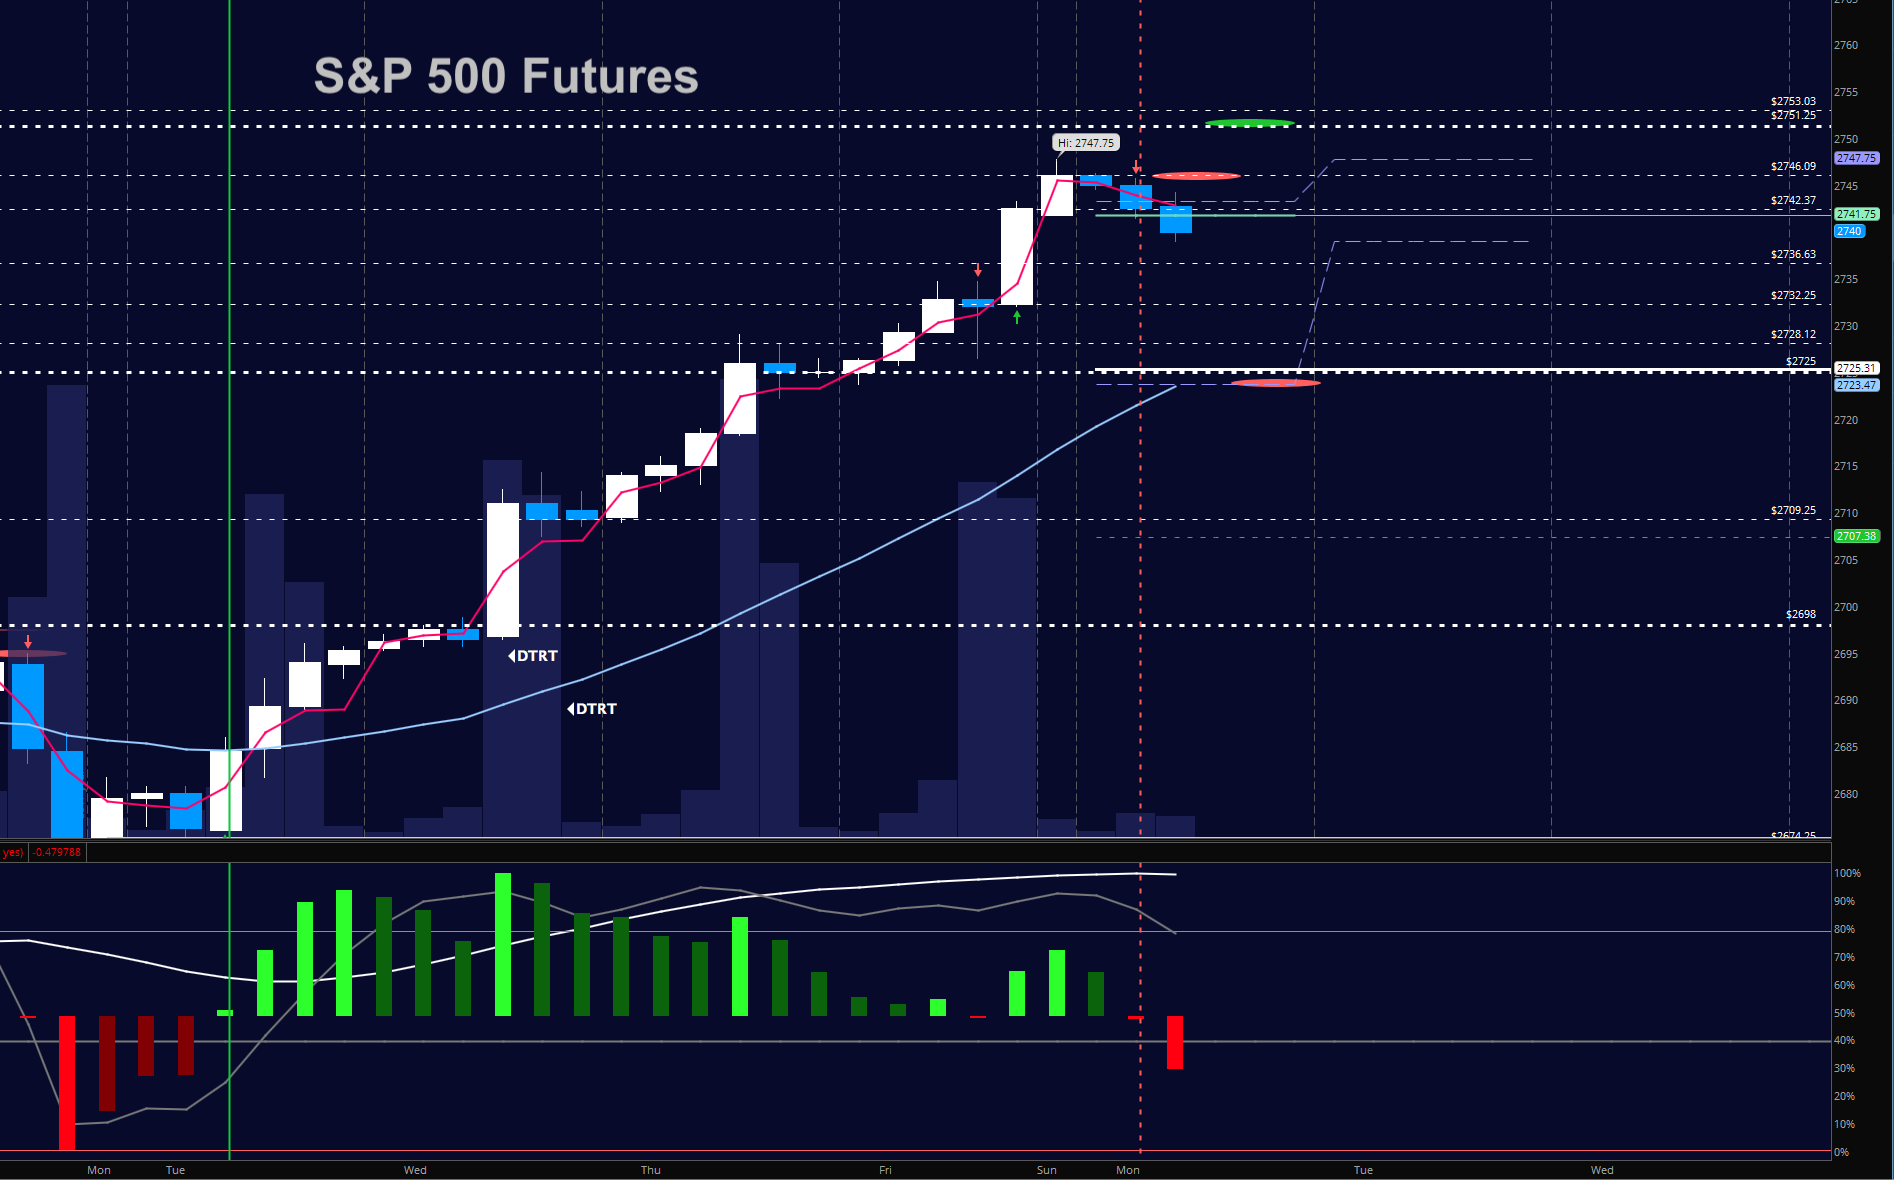
S&P 500 Futures Trading Update: Time For A Breather
The broader stock market futures indices have stalled out at new highs made Sunday night. Stocks should find support at lower levels.
S&P 500 Trading...
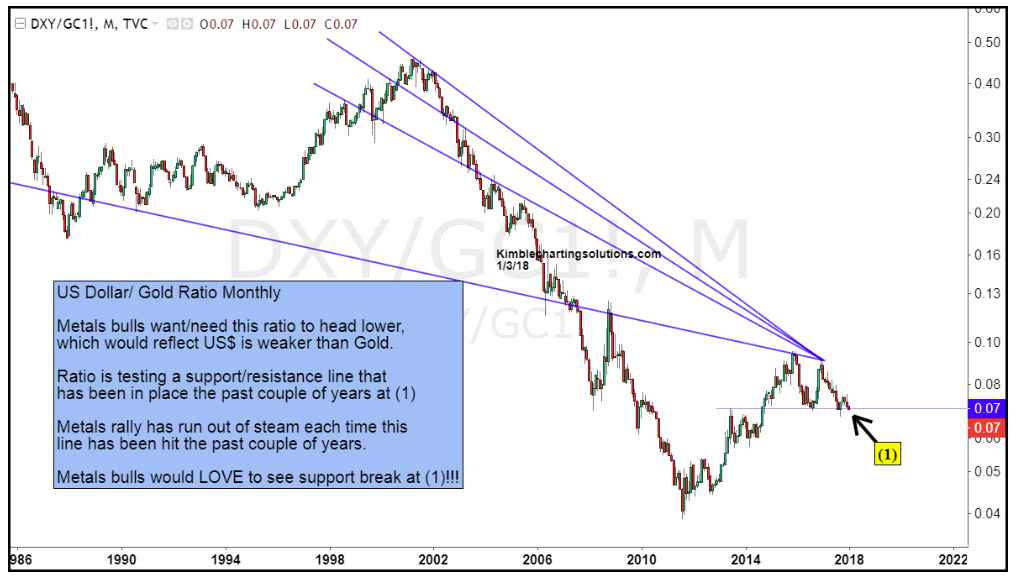
Can Gold Bulls Capitalize On U.S. Dollar Weakness?
The U.S. Dollar plays a big role in commodities prices. It's always a "must-watch" for commodity traders.
Typically, a falling Dollar bodes well for commodities...
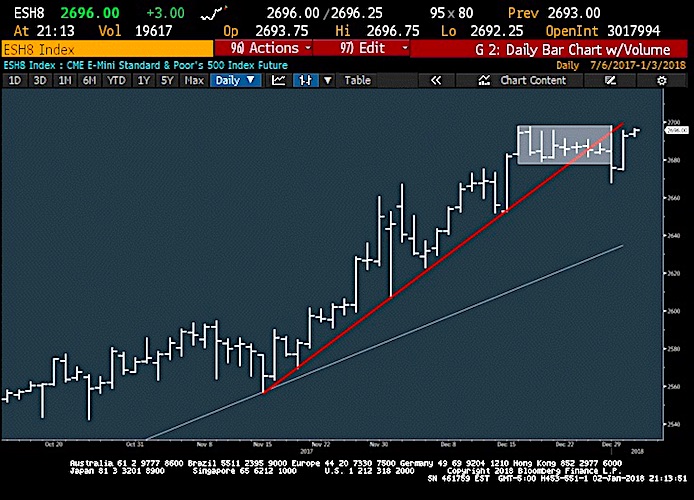
S&P 500 Trading Outlook: Equities Rally Extended
S&P 500 Trading Outlook (2-3 Days): BULLISH
Yesterday's recovery of last week's decline suggests an upcoming push back to new highs is likely for equities. This...
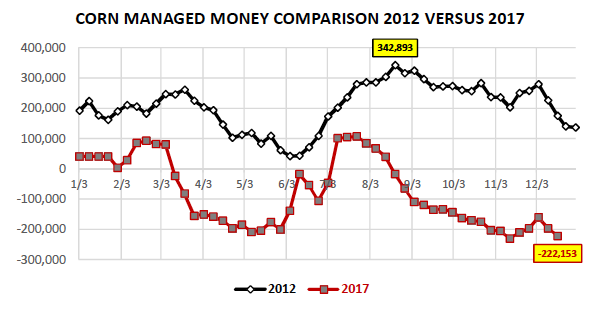
2018 U.S. Corn Market Outlook: The Bulls Wish List
With March corn futures continuing to languish well below $4.00 per bushel heading into 2018 and memories of $6.00, $7.00, and even $8.00 per...
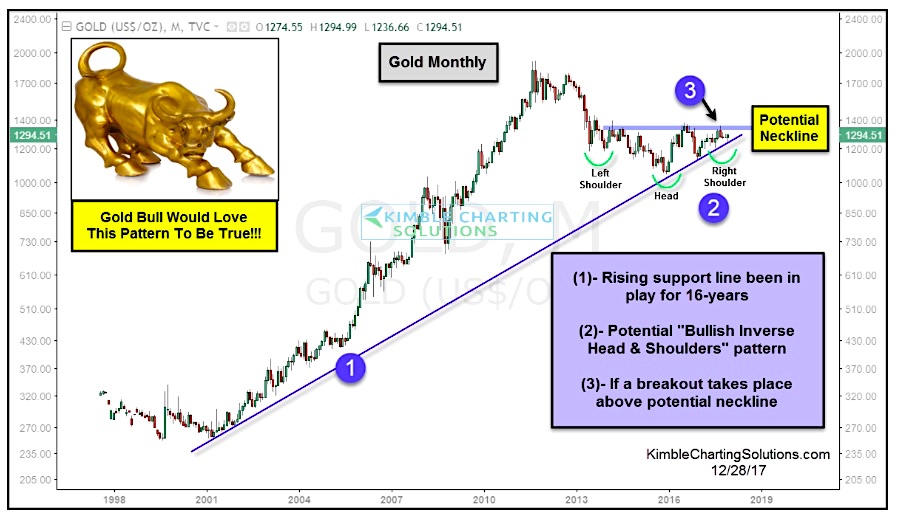
Gold Bulls Hope This Chart Pattern Leads To Big Rally
The past 6 years have been difficult for gold bulls. After the 2011 market top for precious metals, gold experienced a waterfall decline followed...
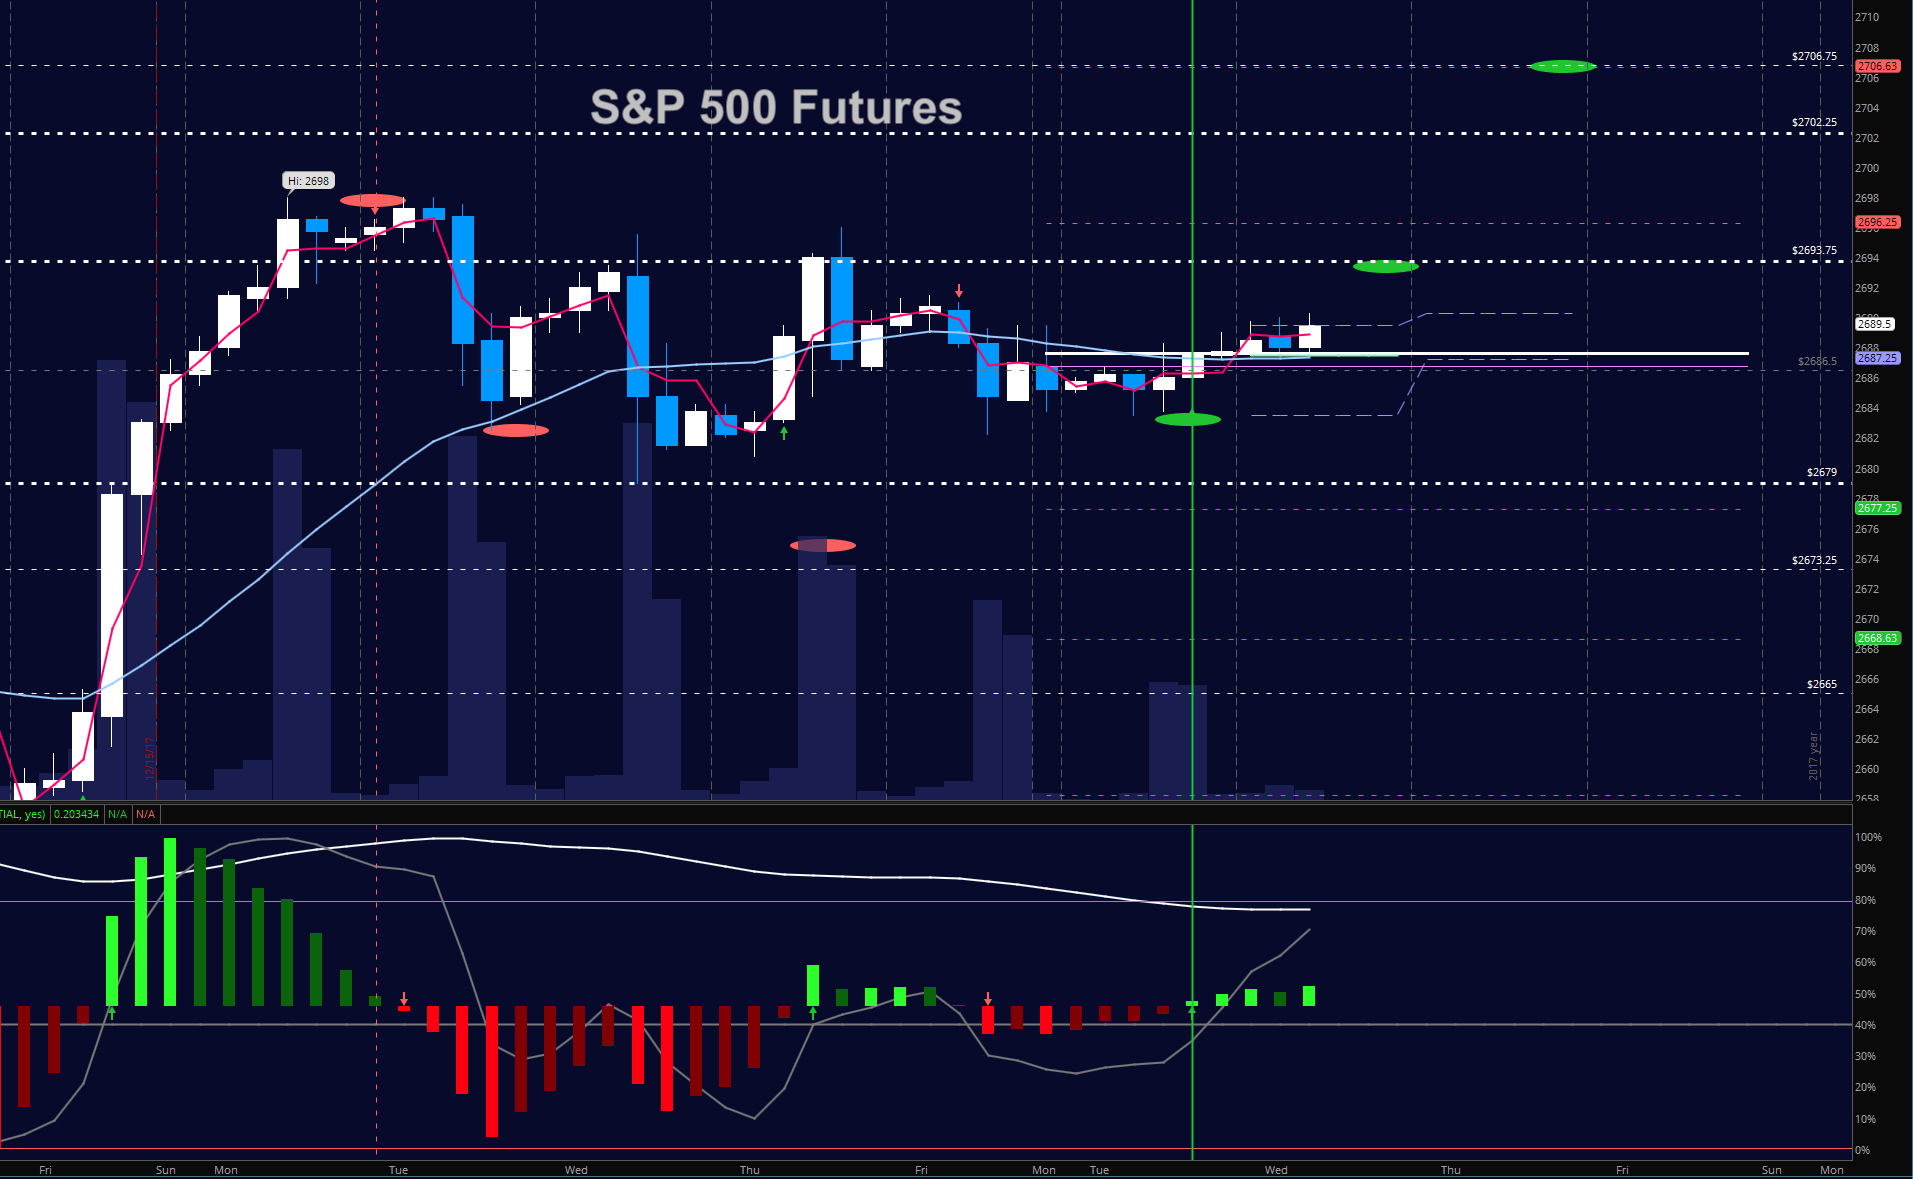
Stock Market Futures Trading Update & Outlook – December 27
S&P 500 trading considerations for December 27, 2017
Stocks are trading sideways in early morning action across the major stock market futures indices. The holidays...

