The U.S. Dollar plays a big role in commodities prices. It’s always a “must-watch” for commodity traders.
Typically, a falling Dollar bodes well for commodities (priced in dollars). And we’ve seen this dynamic play out with Gold and precious metals of late.
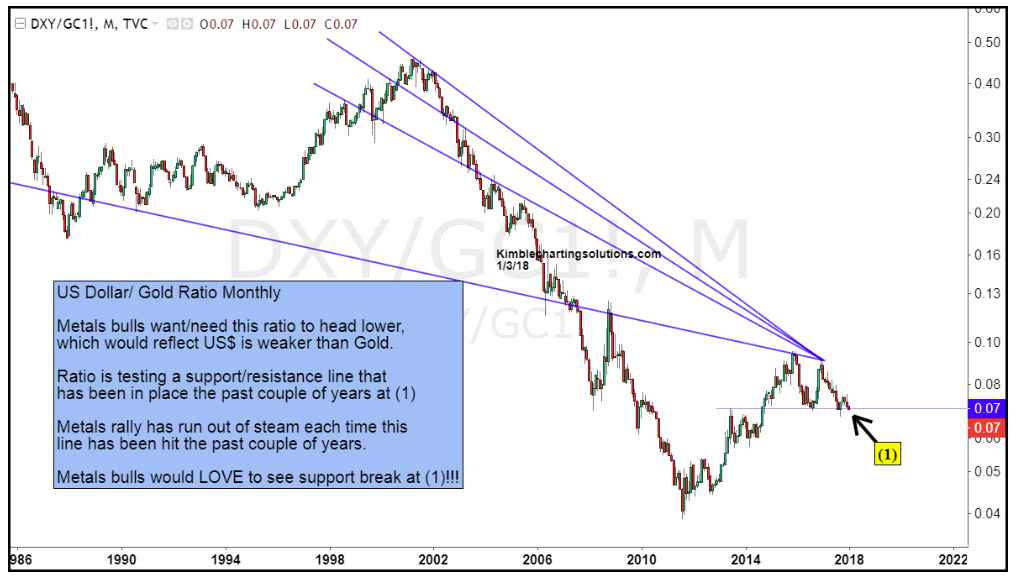
One indicator that gold bulls and bears like to watch is the U.S. Dollar / Gold ratio. I’ve charted the 30 year chart below.
When this ratio if rising, it means the dollar is showing relative strength to gold… (and Gold usually struggles). See periods 1987-2001 and 2011-2016 on the chart below. When this ratio is falling, it tends to be a tailwind for gold prices. See 2002-2011 on chart below.
Is the ratio beginning another period of weakness? Gold bulls sure hope so.
After bumping up against a convergence of price resistance, the ratio has fallen to test important support at point (1). This support level has been tested twice in the past couple years and each time it held (and stalled gold rallies). Remember, precious metals bulls want to see this ratio keep falling… so Gold bulls would LOVE to see support break at point (1). Stay tuned!
U.S. Dollar / Gold Ratio 30 Year Chart
ALSO READ: Gold Bulls Are Watching This Pattern
Twitter: @KimbleCharting
Any opinions expressed herein are solely those of the author, and do not in any way represent the views or opinions of any other person or entity.


